Marketing strategy is the part of the field that asks how a firm wins, not how a consumer chooses. Where most of the book studies decisions one customer at a time, this chapter steps up a level of analysis to the firm, and asks how the firm creates value for customers, captures part of that value for itself, and sustains the arrangement against rivals who would rather it did not. Marketing strategy is the integrated pattern of decisions through which a firm does this: which markets to serve, which customers to win and keep, what to be known for, where to invest the marketing budget, and how to organize the people who execute it. The unifying test is performance. A marketing strategy is judged not by how clever it sounds but by the customer, financial, stock-market, and societal outcomes it produces (Varadarajan 2010; Neil A. Morgan et al. 2018).
This chapter is a teaching treatment of the field, complementing the doctoral reading map in Chapter 60. The seminar chapter is organized as a fourteen-week syllabus that pairs each topic with its identification challenge; this chapter develops the substantive theory in continuous prose, with two small runnable demonstrations. Two commitments run through both. The first is integration: a strategy is a coherent pattern, not a list of independent marketing-mix moves, even though most empirical work has studied the parts rather than the pattern (Neil A. Morgan et al. 2018). The second is accountability: the soft-sounding constructs of strategy, orientation, capability, culture, relationships, are repeatedly forced into contact with hard outcome data, because that contact is what turns a plausible story into a finding.
10.1 What Marketing Strategy Is
It helps to fix vocabulary first, because the field uses two phrases that are easily confused. Strategic marketing names the scholarly field: the study of how marketing contributes to firm strategy and performance. Marketing strategy names its object: the integrated pattern of choices a particular firm makes (Varadarajan 2010). A doctoral student needs both senses, but the second is the one with managerial bite.
10.1.1 Levels of strategy
Strategy is layered, and marketing sits at more than one layer. Corporate strategy decides which businesses the firm should be in. Business strategy (or competitive strategy) decides how a given business unit competes in its chosen market. Functional strategy, including marketing strategy in its narrow sense, decides how each function supports the business-level choice. Marketing is unusual among the functions in that it spans all three levels: it informs corporate choices about which markets have attractive customers, it largely is the business-level question of how to compete for those customers, and it supplies the functional programs (the marketing mix) that execute the plan. This is why marketing’s claim to a seat at the strategy table is contested but persistent: the function’s natural object, the customer and the market, is exactly the object that business-level strategy must get right.
10.1.2 Strategy versus tactics
The cleanest way to separate strategy from tactics is by what each commits the firm to and for how long. Strategy is the small set of choices that are costly to reverse and that constrain everything downstream: which segment to target, what position to own, which capabilities to build. Tactics are the many adjustable moves, this quarter’s price, this campaign’s copy, this promotion’s depth, that execute a strategy and can be changed without changing the firm’s direction. The distinction is not a hierarchy of importance; a brilliant strategy with sloppy tactics fails, and disciplined tactics cannot rescue an incoherent strategy. It is a distinction of reversibility and scope. A useful diagnostic question is: if this decision turns out wrong, how long and how expensive is the path back? Choices with long, expensive paths back are strategic and deserve the deliberation the rest of this chapter describes.
10.1.3 The dependent variable
Because the field is defined by accountability, its recurring dependent variable is firm performance, and that variable has conceptual layers worth separating (Katsikeas et al. 2016; Neil A. Morgan 2012). Closest to marketing actions are customer-mindset outcomes (awareness, satisfaction, loyalty intentions). These feed marketplace outcomes (market share, sales, customer retention), which feed accounting outcomes (margins, cash flow, return on assets), which the capital market prices into financial-market outcomes (stock returns, firm value, risk). Much of the field’s progress has come from tracing this chain link by link, and much of its difficulty comes from the fact that causation can run backward along it (profitable firms can afford more marketing) and that omitted firm-quality variables can drive several links at once.
10.2 Market Orientation
If marketing strategy has a single foundational construct on the implementation side, it is market orientation: the degree to which a firm actually organizes itself around its customers and competitors rather than merely professing to. Two papers in 1990 defined the construct in complementary ways, and the field has spent three decades measuring it and testing whether it pays.
10.2.1 The behavioral view and the cultural view
Kohli and Jaworski (1990) give the behavioral conceptualization. They define market orientation as “the organizationwide generation of market intelligence pertaining to current and future customer needs, dissemination of the intelligence across departments, and responsiveness to it.” The achievement of this definition is that it decomposes a vague cultural posture into three observable behaviors, intelligence generation, dissemination, and responsiveness, and thereby makes the construct measurable (the MARKOR scale follows directly from it). Profitability is deliberately placed as a consequence of orientation, not a part of it, which keeps the construct clean enough to serve as a regressor against performance. The seminar chapter develops this decomposition in detail in Section 60.17.1.
Narver and Slater (1990) give the cultural conceptualization. They define market orientation as the organizational culture that most effectively creates the behaviors needed for superior value, and they decompose it into three components, customer orientation, competitor orientation, and interfunctional coordination, plus two decision criteria (long-term focus and profitability). Their MKTOR scale operationalizes this view, and their paper supplied the first direct test linking orientation to business profitability.
The two views are less rival than layered: culture (Narver and Slater) is the disposition, and behavior (Kohli and Jaworski) is its enactment. A firm can hold customer-oriented values yet fail to generate or act on intelligence; the behavioral view measures whether the disposition actually shows up in routines.
10.2.2 Does market orientation pay, and when?
The headline empirical question is whether more market-oriented firms perform better, and the meta-analytic verdict is a qualified yes. Kirca, Jayachandran, and Bearden (2005) synthesize the accumulated studies and find a positive, robust association between market orientation and performance, but one whose size depends on the setting. The link is stronger when performance is measured by managerial judgment than by objective financials, stronger in studies using cost-based rather than revenue-based outcomes, and moderated by national culture and industry. The honest reading is that market orientation is necessary but not sufficient: it is a precondition for converting market knowledge into value, but its payoff is contingent on the capabilities (next section) that turn knowledge into action and on the competitive context that determines how much customer focus is rewarded.
This sets up the field’s signature identification worry. A cross-sectional correlation between orientation and profit is consistent with orientation causing profit, with profit funding orientation, or with some omitted quality (good management, slack resources) causing both. The demonstration below uses simulated data to show what an honest analyst can and cannot conclude from such a regression, and how a moderator changes the picture.
10.2.3 A simulated market-orientation to performance regression
The following chunk simulates a cross-section of firms, generates performance as a function of market orientation and a moderator (competitive intensity), and then recovers the relationship. The data-generating process is known, so we can see exactly what the regression is estimating. The substantive point is that the return to market orientation is larger where competition is fiercer: customer focus matters most when customers have alternatives.
Code
suppressPackageStartupMessages({library(dplyr); library(ggplot2)})set.seed(2024)n<-600firms<-tibble(# market orientation (standardized index, e.g. MARKOR/MKTOR) mo =rnorm(n, 0, 1),# competitive intensity moderator (0 = sheltered, 1 = cut-throat) intensity =runif(n, 0, 1),# an omitted "firm quality" that raises BOTH mo and performance quality =rnorm(n, 0, 1))# true model: MO helps, and helps MORE under high competitive intensity;# firm quality confounds the naive association.firms<-firms%>%mutate( mo_obs =mo+0.5*quality, # quality inflates MO perf =0.30*mo_obs+# baseline MO effect0.60*mo_obs*intensity+# moderation0.80*quality+# confoundrnorm(n, 0, 1))# (1) naive regression: omits quality -> MO effect is biased upwardnaive<-lm(perf~mo_obs, data =firms)# (2) moderated regression controlling for quality -> recovers structuremoderated<-lm(perf~mo_obs*intensity+quality, data =firms)round(rbind( naive =c(coef(naive)["mo_obs"], NA, NA), moderated =coef(moderated)[c("mo_obs", "intensity", "mo_obs:intensity")]), 3)#> mo_obs #> naive 0.923 NA NA#> moderated 0.239 0.261 0.712
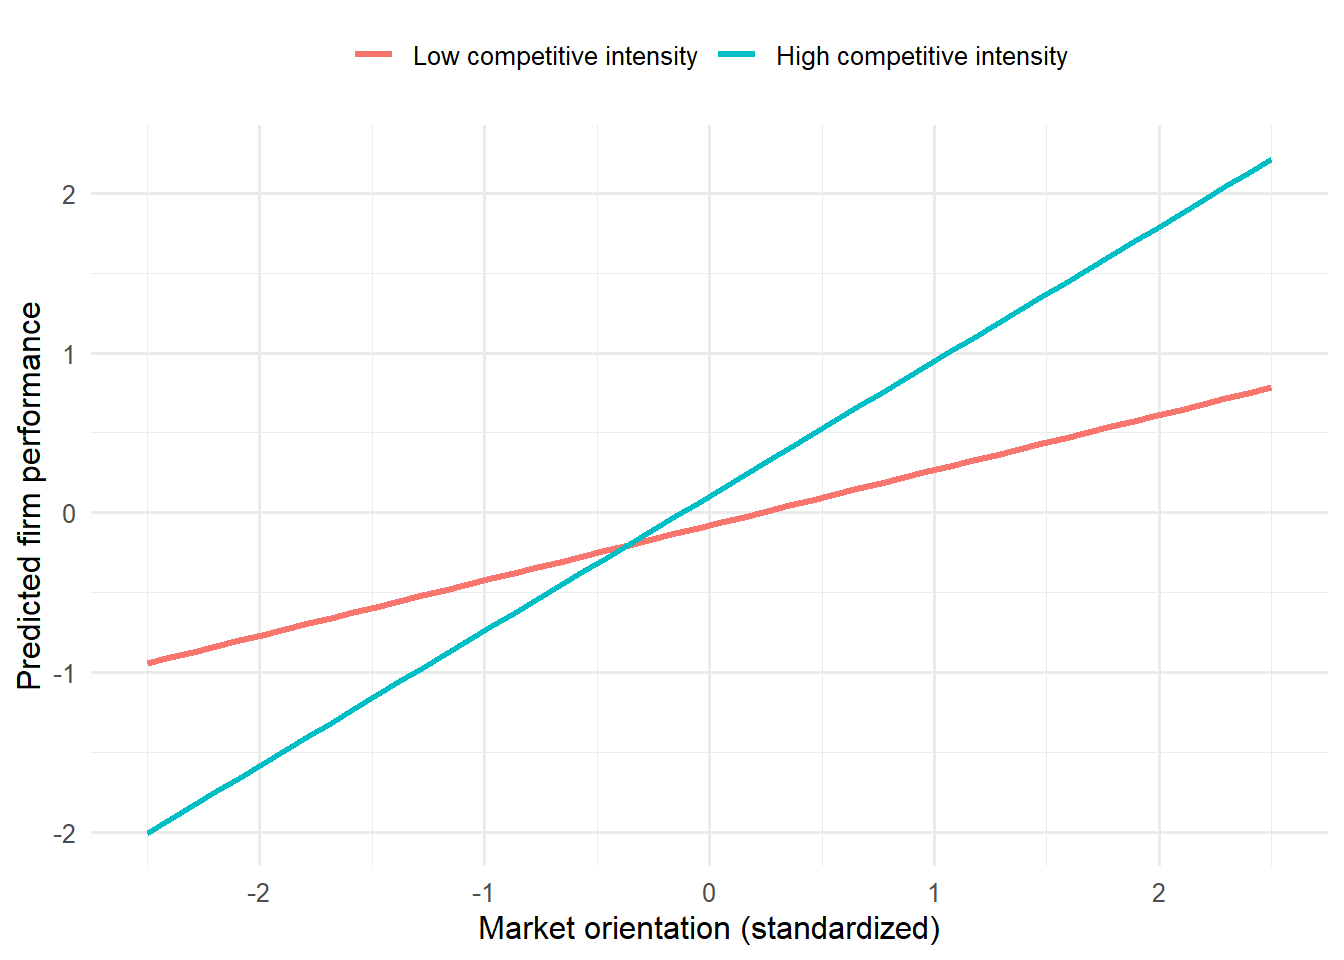
The naive slope on market orientation is inflated because it absorbs the omitted firm-quality effect; the moderated specification, once quality is controlled, recovers a positive main effect and a positive interaction, the return to market orientation rises with competitive intensity. Figure 10.1 plots the fitted performance-orientation slope at low and high competitive intensity to make the moderation visible.
Figure 10.1: Simulated moderation of the market-orientation to performance link by competitive intensity. The fitted slope of performance on market orientation is steeper under high competitive intensity (customers have alternatives) than under low intensity, illustrating that market orientation is necessary but its payoff is contingent (Kirca, Jayachandran, and Bearden 2005).
The lesson generalizes well beyond this toy: a positive average effect can hide substantial heterogeneity, and the moderators (here, competition; in the literature, also market turbulence and national culture) are often the managerially interesting part of the answer.
10.3 Resources, Capabilities, and Sustainable Advantage
Market orientation tells the firm to listen to the market; it does not, by itself, explain why some firms convert what they hear into durable advantage and others do not. For that the field reaches to theories of competitive advantage, and the dominant one is the resource-based view (RBV).
10.3.1 The resource-based view and resource-advantage theory
The RBV holds that sustained advantage comes from resources that are valuable, rare, imperfectly imitable, and non-substitutable (the VRIN tests), and that are embedded in an organization able to exploit them (Wernerfelt 1984). The insight is that resources easily bought or copied cannot support advantage for long, because competitors acquire or replicate them; advantage must rest on resources that resist the market for resources itself. Marketing’s contribution to the RBV is the observation that its most important assets, brand equity, customer relationships, channel ties, market knowledge, are precisely the off-balance-sheet, relationship- and knowledge-based resources that best pass the VRIN tests, a point developed as the market-based assets framework (Srivastava, Shervani, and Fahey 1998) and treated at length in Chapter 23.
Marketing has also produced its own theory of competition. Hunt and Morgan (1995) propose resource-advantage theory (originally the comparative-advantage theory of competition), an evolutionary, disequilibrium alternative to the equilibrium models of industrial-organization economics. In their account, firms compete by seeking comparative advantages in resources that yield marketplace positions of competitive advantage and, in turn, superior financial performance; competition is the ongoing, never-settled process of firms trying to neutralize or leapfrog one another’s resource advantages. The contrast with equilibrium IO is the heart of a recurring seminar debate: are marketing resources truly inimitable sources of lasting rents, or transient advantages constantly eroded by imitation? R-A theory’s answer is that the process of seeking advantage, not any particular static advantage, is what marketing strategy is about.
10.3.2 Marketing capabilities and dynamic capabilities
Resources are inert without the routines that deploy them, and those routines are capabilities. Day (1994) gives the canonical typology of the capabilities of market-driven organizations: outside-in capabilities (market sensing, customer linking, channel bonding) that connect the firm to its environment; inside-out capabilities (manufacturing, logistics, financial management) that are activated by market needs; and spanning capabilities (new-product development, pricing, purchasing, service delivery) that integrate the two. A market-driven firm is one whose outside-in capabilities are strong enough to guide the rest.
Vorhies and Morgan (2005) turn this typology into measurement, showing that distinct marketing capabilities (in pricing, product development, channel management, marketing communications, selling, market information management, and marketing planning and implementation) can be benchmarked and that firms whose capabilities exceed benchmarks perform better. Krasnikov and Jayachandran (2008) then run the horse race that matters for resource allocation: in a meta-analysis comparing marketing, R&D, and operations capabilities, marketing capabilities have the largest relative impact on firm performance, a finding that pushes back on the engineering-centric view that R&D and operations are where advantage is built. Crucially, market orientation and marketing capabilities are complements, not substitutes: orientation supplies the knowledge that capabilities convert into market position (Neil A. Morgan and Rego 2009).
The frontier worry is that static capabilities decay as markets change. Dynamic capabilities, the firm’s capacity to sense opportunities, seize them, and reconfigure its resource base, address strategy under change (Teece, Pisano, and Shuen 1997). Day (2011) brings this into marketing with the marketing capabilities gap: the routines most firms have were built for a stable, push-marketing world and lag the adaptive, outside-in capabilities (vigilant market learning, adaptive experimentation, open networking) that turbulent digital markets reward. The managerial implication is that capability is a moving target; the resource-based test for sustainability must be re-run as the environment shifts.
10.4 Competitive Strategy and Positioning
Having decided to compete, the firm must decide how. The classic marketing answer is the segmentation, targeting, and positioning (STP) sequence. Segmentation partitions a heterogeneous market into groups of customers with similar needs and responses. Targeting selects which segments the firm’s resources and capabilities let it serve profitably and defensibly. Positioning designs and communicates a distinctive place in the minds of target customers, the position the firm intends to own.
Underlying STP is differentiation: the firm must give target customers a reason to prefer it that rivals cannot easily match. Differentiation can rest on the product, the brand, the service, the channel, or the relationship, but the strategic test is always the same VRIN test from the RBV, a basis of differentiation confers durable advantage only if it is valuable to customers and costly for rivals to imitate. This is why Day and Wensley (1988) insist on separating the sources of advantage (superior skills and resources) from the positions of advantage they produce (superior customer value or lower relative cost) from the performance outcomes that follow (satisfaction, loyalty, share, profitability). Confusing the three is the most common analytic error in positioning research: a firm with high share (a position) is not thereby shown to have a superior capability (a source), because the causal arrow can run either way.
Competitive dynamics adds the recognition that positions are contested in real time. Rivals respond to attacks, match price cuts, copy features, and counter- position, so a position’s value depends on how rivals will react, not only on how customers will. The strategic question is therefore not merely “what position do we want?” but “what position can we hold given how competitors will respond?”, which is where R-A theory’s disequilibrium view (Hunt and Morgan 1995) and the dynamic-capabilities view (Teece, Pisano, and Shuen 1997; Day 2011) re-enter: a defensible position is one anchored to a capability rivals cannot quickly reconfigure to match.
10.5 The Marketing-Finance Interface: The Accountability Turn
The most consequential development in marketing strategy over the last quarter century is the accountability turn: the insistence that marketing demonstrate its value in the language the boardroom and the capital market actually use, cash flow, firm value, and risk. This is the subject of its own chapter (Chapter 23); here we give the strategic logic and a panel demonstration.
10.5.1 Marketing and shareholder value
The hinge is the market-based assets framework (Srivastava, Shervani, and Fahey 1998), which reframes marketing’s outputs, brand equity, customer equity, channel relationships, as intangible assets that drive the firm’s future cash flows and therefore its value. Under an efficient capital market, actions that build value with customers should build value for shareholders, because a firm is worth the risk-adjusted present value of its expected future cash flows and marketing assets shift those flows in four ways: they can accelerate cash flows, augment their level, reduce their volatility and vulnerability (lowering the discount rate), and raise their residual (terminal) value (Srivastava, Shervani, and Fahey 1998).
Srinivasan and Hanssens (2009) supply the canonical roadmap of how to measure these links: stock- return response models, persistence and vector-autoregression models, and Tobin’s \(q\) regressions, together with the identification toolkit (event studies, factor models, panel methods) the field uses to defend causal claims. The meta-analytic payoff is that marketing variables, brand, customer satisfaction, R&D, advertising, have economically meaningful, positive elasticities on firm value (Edeling and Fischer 2016; Edeling, Srinivasan, and Hanssens 2021). Brand equity (Section 11.3) and customer equity (Chapter 15) are the two strategic assets this literature prices most heavily: strong-brand portfolios earn higher returns at lower risk, and the aggregate lifetime value of the customer base tracks, and helps explain, market capitalization (Kumar and Shah 2009).
10.5.2 A simulated marketing-assets to firm-value panel
The following chunk illustrates, on simulated panel data, the workhorse Tobin’s \(q\) regression of the interface: firm value regressed on a marketing asset (here a brand- equity index) with firm and year fixed effects and the standard financial controls (leverage and cash flow). Fixed effects absorb time-invariant firm quality, so the estimate comes from within-firm variation in the asset over time, the design that makes the marketing-to-value claim credible rather than merely correlational. This reuses the kind of machinery developed in Chapter 23.
Code
suppressPackageStartupMessages({library(dplyr)})set.seed(7)n_firm<-120; n_year<-8firm_fe<-rnorm(n_firm, 0, 0.40)# time-invariant firm qualityyear_fe<-rnorm(n_year, 0, 0.10)panel<-expand.grid(firm =1:n_firm, year =1:n_year)%>%mutate( brand_equity =0.6*firm_fe[firm]+rnorm(n(), 0, 1), # quality raises BE leverage =runif(n(), 0, 0.6), cash_flow =rnorm(n(), 0, 1),# true within-firm effect of brand equity on Tobin's q is 0.25 tobin_q =1.2+firm_fe[firm]+year_fe[year]+0.25*brand_equity-# the strategic effect of interest0.40*leverage+0.15*cash_flow+rnorm(n(), 0, 0.30))# Pooled OLS (no FE) overstates the effect: it confounds within- and between-firmpooled<-lm(tobin_q~brand_equity+leverage+cash_flow, data =panel)# Two-way fixed-effects: identify from WITHIN-firm changes in brand equityfe<-lm(tobin_q~brand_equity+leverage+cash_flow+factor(firm)+factor(year), data =panel)round(c(pooled_BE =coef(pooled)["brand_equity"], FE_BE =coef(fe)["brand_equity"], truth =0.25), 3)#> pooled_BE.brand_equity FE_BE.brand_equity truth #> 0.326 0.242 0.250
The pooled estimate is biased upward because it mixes the genuine within-firm effect with the cross-firm correlation that firm quality induces between brand equity and \(q\); the two-way fixed-effects estimate, which uses only within-firm variation, recovers the true 0.25 elasticity. This is the strategic content of the interface in one line: marketing builds an asset, and a credibly identified panel shows that the asset is priced into the value of the firm. The unresolved debate is whether marketing creates that value or merely signals pre-existing quality, and whether fixed effects and instruments fully purge the reverse-causality and omitted-quality threats (Srinivasan and Hanssens 2009; Edeling, Srinivasan, and Hanssens 2021).
10.6 Marketing Organization, the CMO, and Accountability
Strategy is executed by an organization, and how marketing is organized, and how much influence it wields, is itself a strategic variable. The marketing function’s influence inside the firm rose with the marketing concept and has been contested ever since, with periodic claims that it is declining as analytics, finance, and product functions absorb customer responsibility.
Verhoef and Leeflang (2009) ask what actually drives the marketing department’s clout and find that it rests on accountability (the ability to demonstrate marketing’s financial contribution), innovativeness, and a credible connection to the customer, not on budget size or headcount. The implication is pointed: the accountability turn is not only an intellectual movement but the practical price of marketing’s seat at the strategy table. Departments that cannot speak the language of firm value lose influence to those that can.
Moorman and Day (2016) give the modern integrative framework, defining marketing excellence as “a superior ability to perform essential customer-facing activities that improve customer, financial, stock market, and societal outcomes” and resting it on four organizational elements (capabilities, configuration, human capital, and culture) mobilized through seven activities. This MARORG framework is developed as a worked capability theory in Section 60.17.2.
The sharpest test of marketing’s organizational value is the chief marketing officer. Does having a CMO in the top management team improve performance? The natural design compares firms with and without a CMO (Nath and Mahajan 2008), and the cleanest estimate finds firms with a CMO exhibit roughly 15% higher Tobin’s \(q\)(Germann, Ebbes, and Grewal 2015). But CMO presence is not randomly assigned, so the credible design combines firm fixed effects (identifying from within-firm changes in CMO presence) with instrumental variables (whose exclusion restriction is the untestable assumption on which the causal claim rests). The seminar chapter develops this as a worked identification example in Section 60.17.5, and it is the template for the whole field: a strategic construct becomes a finding only when its estimator and identifying assumptions are stated in full.
Underpinning all of this is measurement. Katsikeas et al. (2016) map the space of marketing performance outcomes (customer-mindset, marketplace, accounting, financial-market), and the recurring empirical result is that the ability to measure marketing is itself associated with performance and with executives’ confidence in the function. Whether measurement causes performance or better firms simply measure more is the same endogeneity question in a new guise.
10.7 Innovation and Growth Strategy
Growth is the strategic objective that most directly tests a firm’s resource base, and innovation is its primary engine. The strategic questions are who innovates radically, whether radical innovation pays, and how a firm can keep exploiting today’s business while exploring tomorrow’s.
The intuition that large incumbents cannot innovate radically turns out to be overstated. Chandy and Tellis (2000) show, against the “incumbent’s curse” assumption, that incumbents and large firms have introduced a substantial share of radical product innovations, especially in some eras and industries; the curse is contingent, not a law. Innovation’s payoff is also two-dimensional: it affects both the level of firm value and its risk, and radical and incremental innovations differ in how they move each, so a complete strategic assessment of an innovation portfolio must weigh return against the volatility it introduces.
The deeper organizational problem is ambidexterity: the firm must simultaneously exploit existing competencies (refining today’s products, serving today’s customers) and explore new ones (radical innovation, new markets), even though the two demand opposed structures, cultures, and metrics. Exploitation rewards efficiency, control, and incrementalism; exploration rewards slack, autonomy, and tolerance of failure. The dynamic-capabilities view (Teece, Pisano, and Shuen 1997; Day 2011) frames ambidexterity as the higher-order capability of reconfiguring the resource base, and it connects growth strategy back to the chapter’s spine: the firms that sustain advantage are those whose capabilities let them keep changing what they are good at.
10.8 The Frontier and a Research Agenda
The field’s own assessments of where it stands converge on a few themes. Varadarajan (2010) defines the domain and its foundational premises and, in doing so, exposes how fragmented the field’s empirical base is. Neil A. Morgan et al. (2019) survey the state of marketing-strategy research and argue that the field has over-studied isolated marketing-mix decisions and under-studied integrated strategy, the pattern that the opening of this chapter insists is the real object; they call for more work on strategy content (the substance of what firms decide), strategy process (how decisions get made and implemented), and strategy implementation, and for designs that take causal identification seriously.
Three further fronts are active. First, empirical generalizations: meta-analyses now pin down replication-grade facts, advertising elasticities (Sethuraman, Tellis, and Briesch 2011), the market-orientation to performance link (Kirca, Jayachandran, and Bearden 2005), marketing’s elasticity on firm value (Edeling and Fischer 2016), so that strategy debates can be settled with accumulated evidence rather than single studies. Second, integrating logics: service-dominant logic reframes value as co-created with customers rather than embedded in products (Vargo and Lusch 2004), a lens that, depending on one’s view, either adds explanatory power or relabels existing constructs. Third, the emerging modules the field is racing to absorb: digital and platform strategy, privacy as strategy, AI as both a marketing capability and a competitive disruptor, ESG and firm value, and causal machine learning for heterogeneous strategic effects. Each follows the same template this chapter has modeled, a substantive construct, an estimator, and an explicit set of identifying assumptions.
The through-line for a doctoral reader is that marketing strategy is where the field is held accountable. Its constructs are interesting, but they earn their place only when forced into contact with outcome data under a credible design. The two simulations in this chapter, market orientation moderated by competition, and a marketing asset priced into firm value, are deliberately small instances of that discipline: each states a data-generating process, then shows what an honest estimator can and cannot recover from it.
10.9 Key Takeaways
Marketing strategy is the firm-level, integrated pattern of choices through which a firm creates, captures, and sustains customer value, judged by customer, financial, stock-market, and societal performance (Varadarajan 2010; Neil A. Morgan et al. 2018). Strategy is distinguished from tactics by reversibility and scope, not by importance.
Market orientation is the foundational implementation construct, conceived behaviorally as intelligence generation, dissemination, and responsiveness (Kohli and Jaworski 1990) and culturally as customer, competitor, and interfunctional orientation (Narver and Slater 1990). It pays on average but is necessary, not sufficient, and its payoff is moderated by competition and context (Kirca, Jayachandran, and Bearden 2005).
Positioning (STP and differentiation) must separate the sources, positions, and performance outcomes of advantage (Day and Wensley 1988), and a defensible position is anchored to a capability rivals cannot quickly match.
Marketing’s organizational influence depends on accountability, innovativeness, and customer connection (Verhoef and Leeflang 2009); marketing excellence rests on four elements and seven activities (Moorman and Day 2016); and the CMO’s value, a roughly 15% Tobin’s \(q\) premium, is a finding only because its design confronts endogeneity (Germann, Ebbes, and Grewal 2015).
The agenda (Neil A. Morgan et al. 2019; Neil A. Morgan 2012) is to study integrated strategy rather than isolated tactics, to accumulate empirical generalizations (Sethuraman, Tellis, and Briesch 2011), and to absorb digital, platform, privacy, and AI strategy under the same discipline of construct, estimator, and identifying assumption.
Chandy, Rajesh K., and Gerard J. Tellis. 2000. “The Incumbent’s Curse? Incumbency, Size, and Radical Product Innovation.”Journal of Marketing 64 (3): 1–17. https://doi.org/10.1509/jmkg.64.3.1.18033.
Day, George S., and Robin Wensley. 1988. “Assessing Advantage: A Framework for Diagnosing Competitive Superiority.”Journal of Marketing 52 (2): 1–20. https://doi.org/10.1177/002224298805200201.
Edeling, Alexander, and Marc Fischer. 2016. “Marketing’s Impact on Firm Value: Generalizations from a Meta-Analysis.”Journal of Marketing Research 53 (4): 515–34. https://doi.org/10.1509/jmr.14.0046.
Edeling, Alexander, Shuba Srinivasan, and Dominique M. Hanssens. 2021. “The Marketingfinance Interface: A New Integrative Review of Metrics, Methods, and Findings and an Agenda for Future Research.”International Journal of Research in Marketing 38 (4): 857–76. https://doi.org/10.1016/j.ijresmar.2020.09.005.
Germann, Frank, Peter Ebbes, and Rajdeep Grewal. 2015. “The Chief Marketing Officer Matters!”Journal of Marketing 79 (3): 1–22. https://doi.org/10.1509/jm.14.0244.
Hunt, Shelby D., and Robert M. Morgan. 1995. “The Comparative Advantage Theory of Competition.”Journal of Marketing 59 (2): 1–15. https://doi.org/10.1177/002224299505900201.
Katsikeas, Constantine S., Neil A. Morgan, Leonidas C. Leonidou, and G. Tomas M. Hult. 2016. “Assessing Performance Outcomes in Marketing.”Journal of Marketing 80 (2): 1–20. https://doi.org/10.1509/jm.15.0287.
Kirca, Ahmet H., Satish Jayachandran, and William O. Bearden. 2005. “Market Orientation: A Meta-Analytic Review and Assessment of Its Antecedents and Impact on Performance.”Journal of Marketing 69 (2): 24–41. https://doi.org/10.1509/jmkg.69.2.24.60761.
Kohli, Ajay K., and Bernard J. Jaworski. 1990. “Market Orientation: The Construct, Research Propositions, and Managerial Implications.”Journal of Marketing 54 (2): 1. https://doi.org/10.2307/1251866.
Krasnikov, Alexander, and Satish Jayachandran. 2008. “The Relative Impact of Marketing, Research-and-Development, and Operations Capabilities on Firm Performance.”Journal of Marketing 72 (4): 1–11. https://doi.org/10.1509/jmkg.72.4.001.
Kumar, V., and Denish Shah. 2009. “Expanding the Role of Marketing: From Customer Equity to Market Capitalization.”Journal of Marketing 73 (6): 119–36. https://doi.org/10.1509/jmkg.73.6.119.
Moorman, Christine, and George S. Day. 2016. “Organizing for Marketing Excellence.”Journal of Marketing 80 (6): 6–35. https://doi.org/10.1509/jm.15.0423.
Morgan, Neil A, and Lopo L Rego. 2009. “Brand Portfolio Strategy and Firm Performance.”Journal of Marketing 73 (1): 59–74. https://doi.org/10.1509/jmkg.73.1.59.
Morgan, Neil A., Kimberly A. Whitler, Hui Feng, and Simos Chari. 2018. “Research in Marketing Strategy.”Journal of the Academy of Marketing Science 47 (1): 4–29. https://doi.org/10.1007/s11747-018-0598-1.
Narver, John C., and Stanley F. Slater. 1990. “The Effect of a Market Orientation on Business Profitability.”Journal of Marketing 54 (4): 20–35. https://doi.org/10.1177/002224299005400403.
Nath, Pravin, and Vijay Mahajan. 2008. “Chief Marketing Officers: A Study of Their Presence in Firms’Top Management Teams.”Journal of Marketing 72 (1): 65–81. https://doi.org/10.1509/jmkg.72.1.065.
Sethuraman, Raj, Gerard J. Tellis, and Richard A. Briesch. 2011. “How Well Does Advertising Work? Generalizations from Meta-Analysis of Brand Advertising Elasticities.”Journal of Marketing Research 48 (3): 457–71. https://doi.org/10.1509/jmkr.48.3.457.
Srinivasan, Shuba, and Dominique M. Hanssens. 2009. “Marketing and Firm Value: Metrics, Methods, Findings, and Future Directions.”Journal of Marketing Research 46 (3): 293–312. https://doi.org/10.1509/jmkr.46.3.293.
Srivastava, Rajendra K., Tasadduq A. Shervani, and Liam Fahey. 1998. “Market-Based Assets and Shareholder Value: A Framework for Analysis.”Journal of Marketing 62 (1): 2–18. https://doi.org/10.1177/002224299806200102.
Varadarajan, Rajan. 2010. “Strategic Marketing and Marketing Strategy: Domain, Definition, Fundamental Issues and Foundational Premises.”Journal of the Academy of Marketing Science 38 (2): 119–40. https://doi.org/10.1007/s11747-009-0176-7.
Vargo, Stephen L., and Robert F. Lusch. 2004. “Evolving to a New Dominant Logic for Marketing.”Journal of Marketing 68 (1): 1–17. https://doi.org/10.1509/jmkg.68.1.1.24036.
Verhoef, Peter C., and Peter S. H. Leeflang. 2009. “Understanding the Marketing Department’s Influence Within the Firm.”Journal of Marketing 73 (2): 14–37. https://doi.org/10.1509/jmkg.73.2.14.
Vorhies, Douglas W., and Neil A. Morgan. 2005. “Benchmarking Marketing Capabilities for Sustainable Competitive Advantage.”Journal of Marketing 69 (1): 80–94. https://doi.org/10.1509/jmkg.69.1.80.55505.
# Marketing Strategy {#sec-marketing-strategy}Marketing strategy is the part of the field that asks how a firm wins, not how aconsumer chooses. Where most of the book studies decisions one customer at a time,this chapter steps up a level of analysis to the firm, and asks how the firmcreates value for customers, captures part of that value for itself, and sustainsthe arrangement against rivals who would rather it did not. Marketing strategy isthe integrated pattern of decisions through which a firm does this: which marketsto serve, which customers to win and keep, what to be known for, where to investthe marketing budget, and how to organize the people who execute it. The unifyingtest is performance. A marketing strategy is judged not by how clever it soundsbut by the customer, financial, stock-market, and societal outcomes it produces[@varadarajan2010; @morgan2018].This chapter is a teaching treatment of the field, complementing the doctoralreading map in @sec-marketing-strategy-seminar. The seminar chapter is organizedas a fourteen-week syllabus that pairs each topic with its identificationchallenge; this chapter develops the substantive theory in continuous prose, withtwo small runnable demonstrations. Two commitments run through both. The first is*integration*: a strategy is a coherent pattern, not a list of independentmarketing-mix moves, even though most empirical work has studied the parts ratherthan the pattern [@morgan2018]. The second is *accountability*: the soft-soundingconstructs of strategy, orientation, capability, culture, relationships, arerepeatedly forced into contact with hard outcome data, because that contact iswhat turns a plausible story into a finding.## What Marketing Strategy Is {#sec-ms-domain}It helps to fix vocabulary first, because the field uses two phrases that areeasily confused. *Strategic marketing* names the scholarly field: the study of howmarketing contributes to firm strategy and performance. *Marketing strategy* namesits object: the integrated pattern of choices a particular firm makes[@varadarajan2010]. A doctoral student needs both senses, but the second is theone with managerial bite.### Levels of strategyStrategy is layered, and marketing sits at more than one layer. *Corporatestrategy* decides which businesses the firm should be in. *Business strategy* (orcompetitive strategy) decides how a given business unit competes in its chosenmarket. *Functional strategy*, including marketing strategy in its narrow sense,decides how each function supports the business-level choice. Marketing is unusualamong the functions in that it spans all three levels: it informs corporatechoices about which markets have attractive customers, it largely *is* thebusiness-level question of how to compete for those customers, and it supplies thefunctional programs (the marketing mix) that execute the plan. This is whymarketing's claim to a seat at the strategy table is contested but persistent: thefunction's natural object, the customer and the market, is exactly the object thatbusiness-level strategy must get right.### Strategy versus tacticsThe cleanest way to separate strategy from tactics is by what each commits thefirm to and for how long. *Strategy* is the small set of choices that are costly toreverse and that constrain everything downstream: which segment to target, whatposition to own, which capabilities to build. *Tactics* are the many adjustablemoves, this quarter's price, this campaign's copy, this promotion's depth, thatexecute a strategy and can be changed without changing the firm's direction. Thedistinction is not a hierarchy of importance; a brilliant strategy with sloppytactics fails, and disciplined tactics cannot rescue an incoherent strategy. It isa distinction of *reversibility and scope*. A useful diagnostic question is: ifthis decision turns out wrong, how long and how expensive is the path back? Choiceswith long, expensive paths back are strategic and deserve the deliberation the restof this chapter describes.### The dependent variableBecause the field is defined by accountability, its recurring dependent variable is*firm performance*, and that variable has conceptual layers worth separating[@katsikeas2016; @morgan2012performance]. Closest to marketing actions are*customer-mindset* outcomes (awareness, satisfaction, loyalty intentions). Thesefeed *marketplace* outcomes (market share, sales, customer retention), which feed*accounting* outcomes (margins, cash flow, return on assets), which the capitalmarket prices into *financial-market* outcomes (stock returns, firm value, risk).Much of the field's progress has come from tracing this chain link by link, andmuch of its difficulty comes from the fact that causation can run backward along it(profitable firms can afford more marketing) and that omitted firm-qualityvariables can drive several links at once.## Market Orientation {#sec-ms-market-orientation}If marketing strategy has a single foundational construct on the implementationside, it is *market orientation*: the degree to which a firm actually organizesitself around its customers and competitors rather than merely professing to. Twopapers in 1990 defined the construct in complementary ways, and the field has spentthree decades measuring it and testing whether it pays.### The behavioral view and the cultural view@kohli1990 give the *behavioral* conceptualization. They define market orientationas "the organizationwide generation of market intelligence pertaining to currentand future customer needs, dissemination of the intelligence across departments,and responsiveness to it." The achievement of this definition is that itdecomposes a vague cultural posture into three *observable behaviors*, intelligencegeneration, dissemination, and responsiveness, and thereby makes the constructmeasurable (the MARKOR scale follows directly from it). Profitability isdeliberately placed as a *consequence* of orientation, not a part of it, whichkeeps the construct clean enough to serve as a regressor against performance. Theseminar chapter develops this decomposition in detail in@sec-strategy-market-orientation.@narver1990 give the *cultural* conceptualization. They define market orientationas the organizational culture that most effectively creates the behaviors neededfor superior value, and they decompose it into three components, customerorientation, competitor orientation, and interfunctional coordination, plus twodecision criteria (long-term focus and profitability). Their MKTOR scaleoperationalizes this view, and their paper supplied the first direct test linkingorientation to business profitability.The two views are less rival than layered: culture (Narver and Slater) is thedisposition, and behavior (Kohli and Jaworski) is its enactment. A firm can holdcustomer-oriented values yet fail to generate or act on intelligence; thebehavioral view measures whether the disposition actually shows up in routines.### Does market orientation pay, and when?The headline empirical question is whether more market-oriented firms performbetter, and the meta-analytic verdict is a qualified yes. @kirca2005 synthesize theaccumulated studies and find a positive, robust association between marketorientation and performance, but one whose size depends on the setting. The link isstronger when performance is measured by managerial judgment than by objectivefinancials, stronger in studies using cost-based rather than revenue-basedoutcomes, and moderated by national culture and industry. The honest reading isthat market orientation is *necessary but not sufficient*: it is a precondition forconverting market knowledge into value, but its payoff is contingent on thecapabilities (next section) that turn knowledge into action and on the competitivecontext that determines how much customer focus is rewarded.This sets up the field's signature identification worry. A cross-sectionalcorrelation between orientation and profit is consistent with orientation causingprofit, with profit funding orientation, or with some omitted quality (goodmanagement, slack resources) causing both. The demonstration below uses simulateddata to show what an honest analyst can and cannot conclude from such a regression,and how a moderator changes the picture.### A simulated market-orientation to performance regressionThe following chunk simulates a cross-section of firms, generates performance as afunction of market orientation *and* a moderator (competitive intensity), and thenrecovers the relationship. The data-generating process is known, so we can seeexactly what the regression is estimating. The substantive point is that thereturn to market orientation is larger where competition is fiercer: customer focusmatters most when customers have alternatives.```{r ms-mo-regression, message=FALSE, warning=FALSE}suppressPackageStartupMessages({library(dplyr); library(ggplot2)})set.seed(2024)n <-600firms <-tibble(# market orientation (standardized index, e.g. MARKOR/MKTOR)mo =rnorm(n, 0, 1),# competitive intensity moderator (0 = sheltered, 1 = cut-throat)intensity =runif(n, 0, 1),# an omitted "firm quality" that raises BOTH mo and performancequality =rnorm(n, 0, 1))# true model: MO helps, and helps MORE under high competitive intensity;# firm quality confounds the naive association.firms <- firms %>%mutate(mo_obs = mo +0.5* quality, # quality inflates MOperf =0.30* mo_obs +# baseline MO effect0.60* mo_obs * intensity +# moderation0.80* quality +# confoundrnorm(n, 0, 1) )# (1) naive regression: omits quality -> MO effect is biased upwardnaive <-lm(perf ~ mo_obs, data = firms)# (2) moderated regression controlling for quality -> recovers structuremoderated <-lm(perf ~ mo_obs * intensity + quality, data = firms)round(rbind(naive =c(coef(naive)["mo_obs"], NA, NA),moderated =coef(moderated)[c("mo_obs", "intensity", "mo_obs:intensity")]), 3)```The naive slope on market orientation is inflated because it absorbs the omittedfirm-quality effect; the moderated specification, once quality is controlled,recovers a positive main effect and a positive interaction, the return to marketorientation rises with competitive intensity. @fig-ms-mo-moderation plots the fittedperformance-orientation slope at low and high competitive intensity to make themoderation visible.```{r}#| label: fig-ms-mo-moderation#| fig-cap: "Simulated moderation of the market-orientation to performance link by competitive intensity. The fitted slope of performance on market orientation is steeper under high competitive intensity (customers have alternatives) than under low intensity, illustrating that market orientation is necessary but its payoff is contingent [@kirca2005]."#| message: false#| warning: falsegrid <-expand.grid(mo_obs =seq(-2.5, 2.5, length.out =50),intensity =c(0.15, 0.85),quality =0)grid$perf <-predict(moderated, newdata = grid)grid$Intensity <-factor(grid$intensity,labels =c("Low competitive intensity","High competitive intensity"))ggplot(grid, aes(mo_obs, perf, colour = Intensity)) +geom_line(linewidth =1.1) +labs(x ="Market orientation (standardized)",y ="Predicted firm performance",colour =NULL) +theme_minimal(base_size =12) +theme(legend.position ="top")```The lesson generalizes well beyond this toy: a positive average effect can hidesubstantial heterogeneity, and the moderators (here, competition; in theliterature, also market turbulence and national culture) are often themanagerially interesting part of the answer.## Resources, Capabilities, and Sustainable Advantage {#sec-ms-rbv}Market orientation tells the firm to listen to the market; it does not, by itself,explain why some firms convert what they hear into durable advantage and others donot. For that the field reaches to theories of competitive advantage, and thedominant one is the resource-based view (RBV).### The resource-based view and resource-advantage theoryThe RBV holds that sustained advantage comes from resources that are valuable,rare, imperfectly imitable, and non-substitutable (the VRIN tests), and that areembedded in an organization able to exploit them [@wernerfelt1984]. The insight isthat resources easily bought or copied cannot support advantage for long, becausecompetitors acquire or replicate them; advantage must rest on resources that resistthe market for resources itself. Marketing's contribution to the RBV is theobservation that its most important assets, brand equity, customer relationships,channel ties, market knowledge, are precisely the off-balance-sheet, relationship-and knowledge-based resources that best pass the VRIN tests, a point developed asthe *market-based assets* framework [@Srivastava_1998] and treated at length in@sec-marketing-finance.Marketing has also produced its own theory of competition. @hunt1995 propose*resource-advantage theory* (originally the comparative-advantage theory ofcompetition), an evolutionary, disequilibrium alternative to the equilibrium modelsof industrial-organization economics. In their account, firms compete by seeking*comparative advantages in resources* that yield marketplace positions ofcompetitive advantage and, in turn, superior financial performance; competition isthe ongoing, never-settled process of firms trying to neutralize or leapfrog oneanother's resource advantages. The contrast with equilibrium IO is the heart of arecurring seminar debate: are marketing resources truly inimitable sources oflasting rents, or transient advantages constantly eroded by imitation? R-A theory'sanswer is that the *process* of seeking advantage, not any particular staticadvantage, is what marketing strategy is about.### Marketing capabilities and dynamic capabilitiesResources are inert without the routines that deploy them, and those routines are*capabilities*. @day1994 gives the canonical typology of the capabilities ofmarket-driven organizations: *outside-in* capabilities (market sensing, customerlinking, channel bonding) that connect the firm to its environment; *inside-out*capabilities (manufacturing, logistics, financial management) that are activated bymarket needs; and *spanning* capabilities (new-product development, pricing,purchasing, service delivery) that integrate the two. A market-driven firm is onewhose outside-in capabilities are strong enough to guide the rest.@vorhies2005 turn this typology into measurement, showing that distinct marketingcapabilities (in pricing, product development, channel management, marketingcommunications, selling, market information management, and marketing planning andimplementation) can be benchmarked and that firms whose capabilities exceedbenchmarks perform better. @krasnikov2008 then run the horse race that matters forresource allocation: in a meta-analysis comparing marketing, R&D, and operationscapabilities, marketing capabilities have the *largest* relative impact on firmperformance, a finding that pushes back on the engineering-centric view that R&D andoperations are where advantage is built. Crucially, market orientation andmarketing capabilities are *complements*, not substitutes: orientation supplies theknowledge that capabilities convert into market position [@morgan2009].The frontier worry is that static capabilities decay as markets change. *Dynamiccapabilities*, the firm's capacity to sense opportunities, seize them, andreconfigure its resource base, address strategy under change [@teece1997]. @day2011brings this into marketing with the *marketing capabilities gap*: the routines mostfirms have were built for a stable, push-marketing world and lag the adaptive,outside-in capabilities (vigilant market learning, adaptive experimentation, opennetworking) that turbulent digital markets reward. The managerial implication isthat capability is a moving target; the resource-based test for *sustainability*must be re-run as the environment shifts.## Competitive Strategy and Positioning {#sec-ms-positioning}Having decided to compete, the firm must decide *how*. The classic marketing answeris the *segmentation, targeting, and positioning* (STP) sequence. *Segmentation*partitions a heterogeneous market into groups of customers with similar needs andresponses. *Targeting* selects which segments the firm's resources and capabilitieslet it serve profitably and defensibly. *Positioning* designs and communicates adistinctive place in the minds of target customers, the position the firm intendsto own.Underlying STP is *differentiation*: the firm must give target customers a reason toprefer it that rivals cannot easily match. Differentiation can rest on the product,the brand, the service, the channel, or the relationship, but the strategic test isalways the same VRIN test from the RBV, a basis of differentiation confers durableadvantage only if it is valuable to customers and costly for rivals to imitate. Thisis why @daywensley1988 insist on separating the *sources* of advantage (superiorskills and resources) from the *positions* of advantage they produce (superiorcustomer value or lower relative cost) from the *performance outcomes* that follow(satisfaction, loyalty, share, profitability). Confusing the three is the mostcommon analytic error in positioning research: a firm with high share (a position)is not thereby shown to have a superior capability (a source), because the causalarrow can run either way.*Competitive dynamics* adds the recognition that positions are contested in realtime. Rivals respond to attacks, match price cuts, copy features, and counter-position, so a position's value depends on how rivals will react, not only on howcustomers will. The strategic question is therefore not merely "what position do wewant?" but "what position can we hold given how competitors will respond?", which iswhere R-A theory's disequilibrium view [@hunt1995] and the dynamic-capabilities view[@teece1997; @day2011] re-enter: a defensible position is one anchored to acapability rivals cannot quickly reconfigure to match.## The Marketing-Finance Interface: The Accountability Turn {#sec-ms-finance}The most consequential development in marketing strategy over the last quartercentury is the *accountability turn*: the insistence that marketing demonstrate itsvalue in the language the boardroom and the capital market actually use, cash flow,firm value, and risk. This is the subject of its own chapter(@sec-marketing-finance); here we give the strategic logic and a paneldemonstration.### Marketing and shareholder valueThe hinge is the *market-based assets* framework [@Srivastava_1998], which reframesmarketing's outputs, brand equity, customer equity, channel relationships, asintangible assets that drive the firm's future cash flows and therefore its value.Under an efficient capital market, actions that build value with customers shouldbuild value for shareholders, because a firm is worth the risk-adjusted presentvalue of its expected future cash flows and marketing assets shift those flows infour ways: they can *accelerate* cash flows, *augment* their level, *reduce* theirvolatility and vulnerability (lowering the discount rate), and raise their*residual* (terminal) value [@Srivastava_1998].@srinivasan2009 supply the canonical roadmap of how to measure these links: stock-return response models, persistence and vector-autoregression models, and Tobin's$q$ regressions, together with the identification toolkit (event studies, factormodels, panel methods) the field uses to defend causal claims. The meta-analyticpayoff is that marketing variables, brand, customer satisfaction, R&D, advertising,have economically meaningful, positive elasticities on firm value[@edeling2016; @edeling2021]. Brand equity (@sec-brand-equity) and customer equity(@sec-clv) are the two strategic assets this literature prices most heavily:strong-brand portfolios earn higher returns at lower risk, and the aggregatelifetime value of the customer base tracks, and helps explain, marketcapitalization [@kumar2009expanding].### A simulated marketing-assets to firm-value panelThe following chunk illustrates, on simulated panel data, the workhorse Tobin's $q$regression of the interface: firm value regressed on a marketing asset (here a brand-equity index) with firm and year fixed effects and the standard financial controls(leverage and cash flow). Fixed effects absorb time-invariant firm quality, so theestimate comes from *within-firm* variation in the asset over time, the design thatmakes the marketing-to-value claim credible rather than merely correlational. Thisreuses the kind of machinery developed in @sec-marketing-finance.```{r ms-firm-value-panel, message=FALSE, warning=FALSE}suppressPackageStartupMessages({library(dplyr)})set.seed(7)n_firm <-120; n_year <-8firm_fe <-rnorm(n_firm, 0, 0.40) # time-invariant firm qualityyear_fe <-rnorm(n_year, 0, 0.10)panel <-expand.grid(firm =1:n_firm, year =1:n_year) %>%mutate(brand_equity =0.6* firm_fe[firm] +rnorm(n(), 0, 1), # quality raises BEleverage =runif(n(), 0, 0.6),cash_flow =rnorm(n(), 0, 1),# true within-firm effect of brand equity on Tobin's q is 0.25tobin_q =1.2+ firm_fe[firm] + year_fe[year] +0.25* brand_equity -# the strategic effect of interest0.40* leverage +0.15* cash_flow +rnorm(n(), 0, 0.30) )# Pooled OLS (no FE) overstates the effect: it confounds within- and between-firmpooled <-lm(tobin_q ~ brand_equity + leverage + cash_flow, data = panel)# Two-way fixed-effects: identify from WITHIN-firm changes in brand equityfe <-lm(tobin_q ~ brand_equity + leverage + cash_flow +factor(firm) +factor(year), data = panel)round(c(pooled_BE =coef(pooled)["brand_equity"],FE_BE =coef(fe)["brand_equity"],truth =0.25), 3)```The pooled estimate is biased upward because it mixes the genuine within-firm effectwith the cross-firm correlation that firm quality induces between brand equity and$q$; the two-way fixed-effects estimate, which uses only within-firm variation,recovers the true 0.25 elasticity. This is the strategic content of the interface inone line: marketing builds an asset, and a credibly identified panel shows that theasset is priced into the value of the firm. The unresolved debate is whethermarketing *creates* that value or merely *signals* pre-existing quality, and whetherfixed effects and instruments fully purge the reverse-causality and omitted-qualitythreats [@srinivasan2009; @edeling2021].## Marketing Organization, the CMO, and Accountability {#sec-ms-organization}Strategy is executed by an organization, and how marketing is organized, and howmuch influence it wields, is itself a strategic variable. The marketing function'sinfluence inside the firm rose with the marketing concept and has been contestedever since, with periodic claims that it is declining as analytics, finance, andproduct functions absorb customer responsibility.@verhoef2009influence ask what actually drives the marketing department's clout andfind that it rests on *accountability* (the ability to demonstrate marketing'sfinancial contribution), *innovativeness*, and a credible connection to thecustomer, not on budget size or headcount. The implication is pointed: theaccountability turn is not only an intellectual movement but the practical price ofmarketing's seat at the strategy table. Departments that cannot speak the languageof firm value lose influence to those that can.@moorman2016 give the modern integrative framework, defining *marketing excellence*as "a superior ability to perform essential customer-facing activities that improvecustomer, financial, stock market, and societal outcomes" and resting it on fourorganizational elements (capabilities, configuration, human capital, and culture)mobilized through seven activities. This MARORG framework is developed as a workedcapability theory in @sec-strategy-excellence.The sharpest test of marketing's organizational value is the *chief marketingofficer*. Does having a CMO in the top management team improve performance? Thenatural design compares firms with and without a CMO [@nath2008], and the cleanestestimate finds firms with a CMO exhibit roughly 15% higher Tobin's $q$[@germann2015]. But CMO presence is not randomly assigned, so the credible designcombines firm fixed effects (identifying from within-firm changes in CMO presence)with instrumental variables (whose exclusion restriction is the untestableassumption on which the causal claim rests). The seminar chapter develops this as aworked identification example in @sec-strategy-cmo, and it is the template for thewhole field: a strategic construct becomes a *finding* only when its estimator andidentifying assumptions are stated in full.Underpinning all of this is *measurement*. @katsikeas2016 map the space of marketingperformance outcomes (customer-mindset, marketplace, accounting, financial-market),and the recurring empirical result is that the *ability to measure marketing* isitself associated with performance and with executives' confidence in the function.Whether measurement causes performance or better firms simply measure more is thesame endogeneity question in a new guise.## Innovation and Growth Strategy {#sec-ms-innovation}Growth is the strategic objective that most directly tests a firm's resource base,and *innovation* is its primary engine. The strategic questions are who innovatesradically, whether radical innovation pays, and how a firm can keep exploiting today'sbusiness while exploring tomorrow's.The intuition that large incumbents cannot innovate radically turns out to beoverstated. @chandy2000 show, against the "incumbent's curse" assumption, thatincumbents and large firms have introduced a substantial share of radical productinnovations, especially in some eras and industries; the curse is contingent, not alaw. Innovation's payoff is also two-dimensional: it affects both the *level* of firmvalue and its *risk*, and radical and incremental innovations differ in how they moveeach, so a complete strategic assessment of an innovation portfolio must weigh returnagainst the volatility it introduces.The deeper organizational problem is *ambidexterity*: the firm must simultaneously*exploit* existing competencies (refining today's products, serving today'scustomers) and *explore* new ones (radical innovation, new markets), even though thetwo demand opposed structures, cultures, and metrics. Exploitation rewardsefficiency, control, and incrementalism; exploration rewards slack, autonomy, andtolerance of failure. The dynamic-capabilities view [@teece1997; @day2011] framesambidexterity as the higher-order capability of reconfiguring the resource base, andit connects growth strategy back to the chapter's spine: the firms that sustainadvantage are those whose capabilities let them keep changing what they are good at.## The Frontier and a Research Agenda {#sec-ms-frontier}The field's own assessments of where it stands converge on a few themes. @varadarajan2010defines the domain and its foundational premises and, in doing so, exposes howfragmented the field's empirical base is. @morgan2019research survey the state ofmarketing-strategy research and argue that the field has over-studied isolatedmarketing-mix decisions and under-studied *integrated strategy*, the pattern that theopening of this chapter insists is the real object; they call for more work onstrategy *content* (the substance of what firms decide), strategy *process* (howdecisions get made and implemented), and strategy *implementation*, and for designsthat take causal identification seriously.Three further fronts are active. First, *empirical generalizations*: meta-analysesnow pin down replication-grade facts, advertising elasticities [@sethuraman2011],the market-orientation to performance link [@kirca2005], marketing's elasticity onfirm value [@edeling2016], so that strategy debates can be settled with accumulatedevidence rather than single studies. Second, *integrating logics*: service-dominantlogic reframes value as co-created with customers rather than embedded in products[@vargo2004], a lens that, depending on one's view, either adds explanatory power orrelabels existing constructs. Third, the *emerging modules* the field is racing toabsorb: digital and platform strategy, privacy as strategy, AI as both a marketingcapability and a competitive disruptor, ESG and firm value, and causal machinelearning for heterogeneous strategic effects. Each follows the same template thischapter has modeled, a substantive construct, an estimator, and an explicit set ofidentifying assumptions.The through-line for a doctoral reader is that marketing strategy is where the fieldis held accountable. Its constructs are interesting, but they earn their place onlywhen forced into contact with outcome data under a credible design. The twosimulations in this chapter, market orientation moderated by competition, and amarketing asset priced into firm value, are deliberately small instances of thatdiscipline: each states a data-generating process, then shows what an honestestimator can and cannot recover from it.## Key Takeaways- Marketing strategy is the firm-level, integrated pattern of choices through which a firm creates, captures, and sustains customer value, judged by customer, financial, stock-market, and societal performance [@varadarajan2010; @morgan2018]. Strategy is distinguished from tactics by reversibility and scope, not by importance.- *Market orientation* is the foundational implementation construct, conceived behaviorally as intelligence generation, dissemination, and responsiveness[@kohli1990] and culturally as customer, competitor, and interfunctional orientation [@narver1990]. It pays on average but is necessary, not sufficient, and its payoff is moderated by competition and context [@kirca2005].- Sustainable advantage rests on VRIN resources [@wernerfelt1984] and the evolutionary, disequilibrium competition of resource-advantage theory [@hunt1995]; marketing capabilities [@day1994; @vorhies2005] convert orientation into position and outweigh R&D and operations capabilities in their performance impact[@krasnikov2008], while dynamic capabilities [@teece1997; @day2011] keep advantage alive under change.- Positioning (STP and differentiation) must separate the *sources*, *positions*, and *performance outcomes* of advantage [@daywensley1988], and a defensible position is anchored to a capability rivals cannot quickly match.- The marketing-finance interface is the accountability turn: marketing assets are off-balance-sheet drivers of firm value [@Srivastava_1998; @srinivasan2009], and credibly identified panels price brand and customer equity into Tobin's $q$[@edeling2016; @kumar2009expanding]. Cross-references: @sec-marketing-finance, @sec-brand-equity, @sec-clv.- Marketing's organizational influence depends on accountability, innovativeness, and customer connection [@verhoef2009influence]; marketing excellence rests on four elements and seven activities [@moorman2016]; and the CMO's value, a roughly 15% Tobin's $q$ premium, is a finding only because its design confronts endogeneity[@germann2015].- The agenda [@morgan2019research; @morgan2012performance] is to study *integrated* strategy rather than isolated tactics, to accumulate empirical generalizations[@sethuraman2011], and to absorb digital, platform, privacy, and AI strategy under the same discipline of construct, estimator, and identifying assumption.