Innovation is the engine of long-run growth in marketing, and it is also one of the field’s hardest objects to measure and to manage. A new product is a bet: the firm commits resources today against an uncertain stream of future demand, and the value of that bet is realized—or destroyed—through the joint behavior of consumers (who must adopt), competitors (who respond), and capital markets (who price the firm’s prospects long before the cash arrives). This chapter treats innovation as the connective tissue between three literatures that are often read separately: the diffusion of new technologies through a population of adopters, the organizational and strategic determinants of who innovates and how much, and the financial valuation of innovation as an intangible asset.
The chapter is organized around the life of an innovation. It begins with diffusion—the canonical models of how an installed base accumulates over time—because diffusion supplies the formal backbone on which forecasting, substitution, and life-cycle tracking are built. It then turns to measurement: how researchers quantify a construct that has no natural unit, leaning heavily on the patent-citation machinery that the empirical literature has standardized. With constructs and measures in hand, it examines the new-product-development (NPD) process inside the firm—teams, capabilities, channels, co-creation, and governance—and the organizational forces (acquisitions, franchising, going public) that expand or erode a firm’s capacity to innovate. It closes with the marketing–finance linkage, where innovation is priced by investors and the construct is finally expressed in returns. Throughout, intuition leads and the formalism follows in full: a reader should leave able to specify a diffusion model, defend a patent-based innovation measure against its known biases, and reason about why markets reward some innovations seven times more than others.
By the end of the chapter the reader will be able to (i) write down and estimate the Bass diffusion model and its successive-generation extension, (ii) construct and critique patent-based innovation measures, and (iii) connect new-product activity to firm value through the event-study logic developed at length in Chapter 23.
25.1 Theoretical Foundations
Before the formal diffusion machinery, it is worth naming the theories that give that machinery its behavioral content. Four strands govern how an innovation spreads and why some spread faster than others.
Diffusion of innovations, in Rogers’s classic synthesis, describes adoption as a process unfolding through communication channels over time across adopter categories: innovators, early adopters, early majority, late majority, and laggards. The Bass model(Bass 1969) is the formal, estimable expression of exactly this idea: its coefficient of innovation \(p\) captures Rogers’s external-influence (media, advertising) channel and its coefficient of imitation \(q\) captures the internal, word-of-mouth contagion among prior adopters, as developed in Equation 25.1. Rogers supplies the sociology; Bass supplies the differential equation.
The technology acceptance model (TAM), Davis’s adaptation of the theory of reasoned action to information technology, holds that adoption intention is driven by two beliefs: perceived usefulness and perceived ease of use. TAM explains adoption at the level of the individual decision that the Bass model aggregates, and it is the microfoundation most often invoked when the innovation is a digital product or platform.
Rogers’s perceived attributes explain the rate of diffusion, that is, why the Bass \(p\) and \(q\) differ so sharply across categories. Five attributes predict adoption speed: relative advantage (the improvement over what it replaces), compatibility (fit with existing values and practices), complexity (inverse ease of understanding and use), trialability (the degree to which it can be experimented with before commitment), and observability (the visibility of its benefits to others). High relative advantage, compatibility, trialability, and observability, and low complexity, accelerate diffusion. These attributes are the behavioral content behind an otherwise atheoretical \(q/p\) ratio.
Network effects modify the diffusion logic for products whose value to each adopter rises with the size of the installed base (communication platforms, standards, marketplaces). Under direct or indirect network externalities the imitation channel is not merely informational but value-creating: each new adopter raises the relative advantage of adoption for everyone else, which steepens the S-curve, can produce tipping and winner-take-most outcomes, and connects diffusion to the platform dynamics treated elsewhere in the book.
25.2 Diffusion of Innovations
Diffusion is the process by which an innovation spreads through a population of potential adopters over time. The central empirical regularity is that cumulative adoption traces an S-curve: slow at first, accelerating as word spreads, then saturating as the pool of non-adopters is exhausted. The modeling task is to give this curve a behavioral micro-foundation so that its parameters carry meaning and can be used for forecasting.
25.2.1 The Bass Model
The workhorse is the Bass model (Bass 1969). Its premise is that the propensity to adopt at time \(t\), conditional on not having adopted yet, is a linear function of how many others have already adopted. Let \(F(t)\) be the cumulative fraction of the market that has adopted by time \(t\), and let \(h(t)\) denote the hazard—the conditional rate of first adoption among those who have not yet adopted. The Bass specification is
where \(f(t) = F'(t)\) is the adoption density. The two parameters carry distinct behavioral content. The coefficient of innovation\(p\) captures the tendency to adopt independently of social influence—external pressure from advertising, media, or intrinsic need—and governs the level of the curve at \(t=0\). The coefficient of imitation\(q\) captures adoption driven by social contagion—word of mouth, observation, network effects—and governs the acceleration once early adopters seed the population. A scale parameter \(m\), the ultimate market potential, converts the fraction \(F(t)\) into a count of adopters \(N(t) = m\,F(t)\).
The Bass model partitions adopters into innovators, who adopt under external influence captured by \(p\), and imitators, whose adoption probability rises linearly with the cumulative number of previous adopters, captured by \(q\)(Bass 1969).
Substituting \(f(t) = h(t)\bigl(1 - F(t)\bigr)\) into Equation 25.1 yields the ordinary differential equation \(f(t) = \bigl(p + qF(t)\bigr)\bigl(1 - F(t)\bigr)\), whose solution under \(F(0)=0\) is the closed form
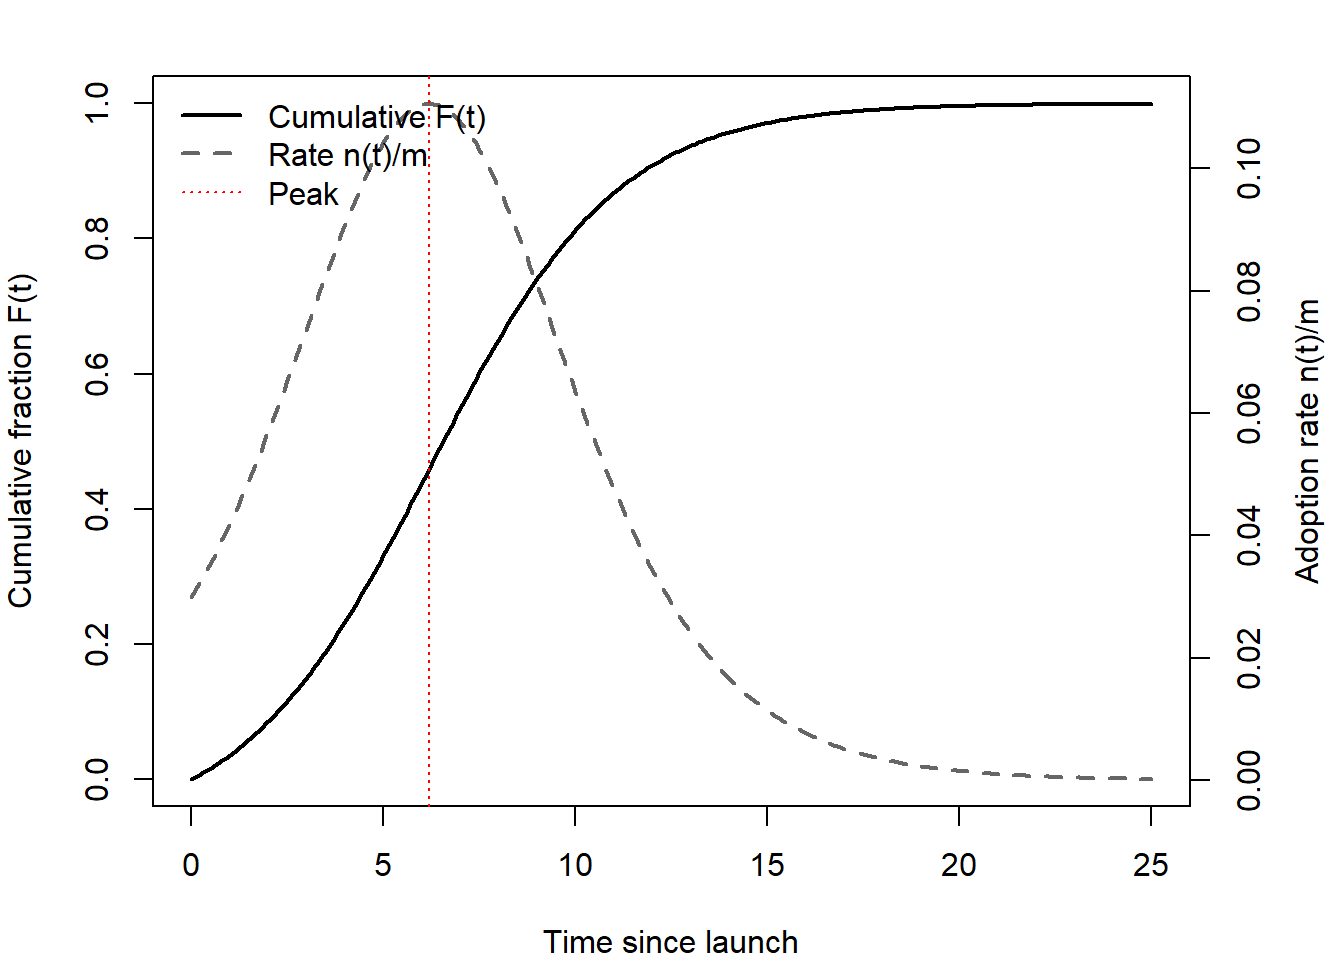
The non-cumulative adoption rate \(n(t) = m\,f(t)\) is hump-shaped whenever \(q > p\), peaking at \(t^{\*} = \tfrac{1}{p+q}\ln(q/p)\); when \(q \le p\) adoption declines monotonically from launch and the S-curve degenerates. The interior peak is what gives durable-goods sales their characteristic rise-and-fall, and the location of that peak is the quantity managers most want to forecast.
Estimation. The original approach regresses discrete-time adoptions on the installed base. Writing \(n_t = m f(t)\) and \(N_{t-1} = m F(t-1)\), the discretized analogue of Equation 25.1 is the quadratic
which is linear in the composite parameters \(\beta_0, \beta_1, \beta_2\) and can be estimated by ordinary least squares (OLS). The structural parameters are then recovered by inversion: \(m\) solves \(\beta_2 m^2 + \beta_1 m + \beta_0 = 0\) (taking the positive root), \(p = \beta_0/m\), and \(q = -\beta_2 m\). OLS on Equation 25.3 is consistent only under strong assumptions, and three failures of identification recur in practice. First, \(N_{t-1}\) is mechanically correlated with the error \(u_t\) when adoption shocks are serially correlated, biasing the coefficients—maximum likelihood or nonlinear least squares on Equation 25.2 is preferred. Second, the parameters are weakly identified before the sales peak: without observations on both sides of \(t^{\*}\), \(m\) and \(q\) trade off and estimates are unstable, which is why early-life forecasts are notoriously fragile. Third, the basic model assumes a fixed market potential and constant\(p, q\); in reality marketing-mix variables, price declines, and successive product generations all shift these quantities, motivating the extensions below. Figure 25.1 plots the cumulative S-curve alongside the hump-shaped adoption rate it implies.
Code
set.seed(1969)p<-0.03; q<-0.38; m<-1t<-seq(0, 25, by =0.1)F_t<-(1-exp(-(p+q)*t))/(1+(q/p)*exp(-(p+q)*t))f_t<-(p+q*F_t)*(1-F_t)# adoption density n(t)/mt_peak<-log(q/p)/(p+q)op<-par(mar =c(4, 4, 2, 4))plot(t, F_t, type ="l", lwd =2, ylim =c(0, 1), xlab ="Time since launch", ylab ="Cumulative fraction F(t)")par(new =TRUE)plot(t, f_t, type ="l", lwd =2, lty =2, col ="grey40", axes =FALSE, xlab ="", ylab ="")axis(4); mtext("Adoption rate n(t)/m", side =4, line =2.5)abline(v =t_peak, col ="red", lty =3)legend("topleft", legend =c("Cumulative F(t)", "Rate n(t)/m", "Peak"), lty =c(1, 2, 3), lwd =c(2, 2, 1), col =c("black", "grey40", "red"), bty ="n")par(op)
Figure 25.1: Bass diffusion: cumulative adoption F(t) and the hump-shaped adoption rate n(t) for p = 0.03, q = 0.38, m = 1. The adoption rate peaks at the inflection point of the S-curve.
25.2.2 Successive Generations and Substitution
Most durable categories do not diffuse once; they diffuse repeatedly as new technological generations replace old ones (mainframes to minicomputers to PCs; 3G to 4G to 5G). A model of a single generation misattributes the decline of an incumbent technology to saturation when it is in fact substitution. Chandrasekaran, Tellis, and James (2020) develop a successive-generations framework that separates two rates the basic Bass model conflates: the rate at which adopters disengage from an older technology and the rate at which they adopt the newer one. Allowing these to differ is what lets the model fit the empirically observed overlap, in which an older generation is still gaining late adopters even as the newer one accelerates—an overlap a single substitution rate cannot reproduce.
The practical payoff is life-cycle tracking. Meade and Rabelo (2004) review the forecasting toolkit for the technology-adoption life cycle and stress that model choice should follow the data regime: pre-peak data demand methods robust to the weak identification noted above, whereas post-peak data permit richer multi-generation specifications. The diffusion literature thus supplies not a single model but a ladder of models indexed by how much of the life cycle the analyst can observe. Figure 25.2 sketches how each generation carries its own adoption process while a distinct disengagement rate governs substitution.
Figure 25.2: Successive-technology diffusion. Each generation has its own adoption process; substitution is governed by a disengagement rate from the incumbent that is distinct from the adoption rate of the successor.
25.3 Measuring Innovation
Innovation has no natural unit, so every empirical claim about it rests on a constructed measure, and the credibility of the claim is only as strong as the measure’s construct validity. Three families dominate. Input measures (R&D expenditure) capture effort but not outcome and are reported inconsistently across firms. Output measures based on new-product introductions—drawn from commercial databases such as product-launch analytics (Wies, Moorman, and Chandy 2023)—capture commercialized innovation but miss the upstream invention that precedes it. Patent-based measures sit between input and market outcome and have become the field’s default because patents are dated, classified, linked to assignees, and connected to one another through citations.
25.3.1 Patent Counts and Their Truncation Problems
The canonical pipeline, exemplified by Chang and Wu (2021), draws granted-patent records (historically from the NBER patent database covering U.S. Patent and Trademark Office grants) and proxies a firm’s annual innovation by two quantities: the count of patents the firm applied for in a year and ultimately had granted, and the citations those patents subsequently receive. Two measurement decisions are load-bearing. First, patents are dated by application year rather than grant year, because application date is closer to the moment of inventive activity. Second, both measures are logged to tame the heavy right tail of the patent distribution.
Two truncation biases must be corrected or the estimates are not interpretable. The application–grant lag truncates recent application years (patents applied for late in the sample have not yet been granted), so the sample is typically ended a few years before the data cutoff. The citation-accumulation lag truncates forward citations for recent patents (they have had less time to be cited), which is addressed with technology-class-by-year fixed effects that net out the systematic component of citation timing. These are not cosmetic adjustments: without them, a spurious downward trend in innovation appears at the end of every sample.
25.3.2 Backward Citations: Novelty
A patent cites prior art. The backward citations a patent makes—the patents it builds on—index how much existing knowledge it recombines, and thus inversely index its novelty.
Citing propensity is defined as the average number of backward citations excluding citations to public research per patent; it reflects a firm’s overall level of citing (Roach and Cohen 2013, 512).
Chandy et al. (2006) use the same logic at the patent level: novelty is measured by the number of backward citations a patent makes, with higher backward citations implying lower novelty, on the reasoning that an idea drawing heavily on existing patents is by construction less of a departure from what came before. Backward counts are available at application time, which makes them attractive as an ex ante measure—unlike the forward citations discussed next.
25.3.3 Forward Citations: Importance
The forward citations a patent receives—later patents that cite it—index its downstream influence, and the literature treats them as the best available proxy for the importance or quality of an invention rather than its mere volume. Tellis, Prabhu, and Chandy (2009) and Cao et al. (2023) both weight patents by forward citations on precisely this ground, and Ahuja and Morris Lampert (2001) operationalize breakthrough inventions as the top 1% of patents by citation weight within their application year. The external validity of the measure is anchored by Trajtenberg (1990), who shows that the more citations a CT-scanner patent receives, the higher its correlation with the technology’s realized improvement surplus—a rare direct link between a citation count and an independent welfare measure (Lampe and Moser 2016). Chandy et al. (2006) summarize idea importance as the total forward-citation count for a patent.
Forward citations have well-understood virtues and a sharp limitation, which the following table organizes.
Table 25.1: Forward versus backward patent citations as innovation measures
Property
Forward citations
Backward citations
Construct measured
Importance / quality / influence
Novelty (inverse)
Timing
Ex post (accrue after grant)
Ex ante (fixed at application)
Manipulability by firm
Low—examiners verify prior art; over-citing narrows own scope
Higher—applicants control what they cite
Principal bias
Right-truncation: older patents accrue more citations
Less time-sensitive
Standard fix
Long window (≈17+ yrs) or class-year fixed effects
—
As Table 25.1 records, the chief threat to forward-citation measures is temporal: because citations accrue over time, older patents mechanically look more important. The standard remedy is a citation window long enough—on the order of seventeen years or more—that the bias from differential accumulation is negligible, supplemented by the class-year fixed effects noted above. The ex post nature of the measure remains a genuine caveat: forward citations cannot recover the importance an inventor or investor could have perceived at the time of patenting, which is exactly the quantity a forward-looking valuation would want. Galasso and Simcoe (2011) exploit this measurement apparatus to study how managerial risk exposure shapes the quantity and the citation-weighted quality of innovation.
25.4 New Product Development
A diffusion curve and a patent count describe innovation from the outside. Inside the firm, innovation is produced by new-product-development processes whose design—who is on the team, what information they have, how decisions are made—shapes whether the resulting product is innovative enough to survive. The recurring finding is that NPD outcomes are contingent: capabilities and team structures have value not in the abstract but conditional on the informational and competitive environment.
25.4.1 Capabilities, Teams, and the Information Environment
Moorman and Slotegraaf (1999) advance a contingency view of NPD capability. Rather than asking whether technological and marketing capabilities raise performance on average, they ask when: the informational content of the external environment modulates how firms deploy their capabilities, affecting both the magnitude and the pace of product development. The value of a capability, on this account, lies in its adaptive deployment against environmental cues, not in its mere existence—a theme that recurs across the NPD literature.
Team composition is the next lever. Sethi, Smith, and Park (2001) study cross-functional NPD teams and locate the primary cause of new-product failure in a lack of innovativeness, defined as the delivery of uniquely meaningful benefits. Innovativeness rises with a strong superordinate team identity, encouragement to take risks, customer influence, and active senior-management monitoring—but it falls with high social cohesion, because cohesive teams suppress the dissent that generates novel options. The interactions are as important as the main effects: the benefit of a superordinate identity is amplified by risk encouragement and damped by social cohesion, while functional diversity per se does not move innovativeness. The emphasis on risk encouragement echoes a robust finding from the creativity literature, that the expectation of evaluation lowers creative output (Amabile, Goldfarb, and Brackfleld 1990): teams that anticipate being judged retreat to safe, conventional options, which is precisely the suppression of novelty that undermines innovativeness. Rebecca J. Slotegraaf and Atuahene-Gima (2011) add a temporal dimension, showing that the relationship between team stability and the comprehensiveness of decision making is curvilinear—too little stability fragments knowledge, too much breeds complacency—and that decision comprehensiveness improves new-product advantage, especially at its upper range.
A structural caution runs through this literature. Grewal et al. (2013) show that the often-mixed findings on how market orientation interacts with the environment can reflect unobserved heterogeneity: estimating finite-mixture (latent-class) regressions reveals multiple regimes with different effect signs, so that pooled estimates suffer aggregation bias. The methodological lesson generalizes—latent heterogeneity in firms’ innovation responses can masquerade as a null or unstable average effect, and disaggregated estimation is the corrective.
25.4.2 Channels, Co-creation, and Forecasting
NPD does not end at the factory gate. Luo, Kannan, and Ratchford (2007) examine new-product development under the constraint of channel acceptance, recognizing that a product that retailers will not stock cannot diffuse regardless of consumer appeal. Ho-Dac, Kumar, and Slotegraaf (2020) study continuous-improvement products (CIPs)—products engineered for post-purchase improvement rather than full replacement—and show that sharing development-progress information raises adoption of the current version, mediated by consumers’ perception of the developer’s commitment to ongoing improvement and moderated by product familiarity. Disclosure, in other words, is itself a marketing instrument.
On the demand-sensing side, Kim and Slotegraaf (2016) challenge the static view of consumer co-creation. Their concept of brand-embedded interaction—dynamic, personalized engagement that steers consumers toward ideas satisfying both their own needs and the brand’s aspirations—yields more constructive NPD ideas in two Twitter-based quasi-field experiments than passive solicitation does. Co-creation quality, that is, is endogenous to how the firm structures the interaction.
Forecasting a durable good before launch is the hardest demand-sensing problem, because there is no sales history to extrapolate. Harz, Hohenberg, and Homburg (2021) deploy virtual reality (VR) for prelaunch sales forecasting of durables, arguing that VR’s visualization capability (simulation scope, similarity to reality, immersion) and automated-tracking capability (interactivity) induce behavioral consistency between participants’ information search, stated preferences, and purchase behavior. The forecasting backbone is the macro-flow model (Figure 25.3), which projects new-product sales over time by specifying a set of behavioral states (awareness, preference, purchase), the flows between them, and the determinants of those flows (Urban, Hauser, and Roberts 1990). Harz, Hohenberg, and Homburg (2021) extend this model with VR-derived virtual purchases and third-party awareness inputs and find improved accuracy—after adjusting for advertising—at both aggregate and individual levels, with presence and vividness as the operative psychological mechanisms.
flowchart LR
    A["Aware"] -->|"info search"| K["Knowledgeable /<br/>Preference formed"]
    K -->|"intend"| I["Purchase intent"]
    I -->|"trial / virtual purchase"| P["Purchase"]
    P -->|"satisfaction"| R["Repeat / WOM"]
    R -.->|"contagion"| A
Figure 25.3: The macro-flow model underlying prelaunch forecasting: consumers flow through behavioral states, and the model estimates the determinants of each transition. Virtual-reality simulations supply the flow inputs before launch (Urban, Hauser, and Roberts 1990; Harz, Hohenberg, and Homburg 2021).
25.4.3 Governance and Organizational Structure
Innovation is governed from the top of the firm. R. Srinivasan, Wuyts, and Mallapragada (2018) study board interlock centrality—how connected a firm’s directors are to other boards—and find it raises incremental new-product introductions by channeling market intelligence into the firm; the effect strengthens with internal and marketing leadership on the board and with a CEO of marketing background, and weakens under pronounced intra-industry external leadership. You et al. (2020) push the upper-echelons logic further, showing that CEO and CMO characteristics—personality, demographics, experience, values—shape both innovation and the stock returns it generates. At the front end of strategy, Molner, Prabhu, and Yadav (2018) show that managers’ market- scoping mindset conditions which markets an innovation reaches: ambiguity avoidance pulls managers toward a downstream, end-user orientation that courts commercialization failure, whereas ambiguity acceptance fosters an upstream orientation that uncovers viable market spaces.
25.5 Organizational Determinants of Innovation
Beyond the project and the boardroom lies the question of which organizational arrangements expand or erode a firm’s stock of innovative capacity—what several authors call its innovation base, the accumulated inventions, ideas, and discoveries that propel future innovation.
25.5.1 Acquisitions and the Innovation Base
The evidence on whether acquisitions help or harm innovation is genuinely mixed, and the resolution is conditional. Hitt et al. (1991) document a negative average effect: acquisition activity reduces R&D inputs and outputs, including patent counts, as managerial attention and capital are absorbed by integration. Mishra and Slotegraaf (2013), analyzing 352 firms across five industries over seventeen years, qualify this: firms that acquire build a more robust innovation base than those that do not, but the benefit depends on the type of acquisition—vertical (across supply-chain stages) versus horizontal (same stage, similar chains)—and, critically, on the breadth of knowledge in the acquiring firm, which determines whether either acquisition type actually enriches the base. King, Slotegraaf, and Kesner (2008) reconcile the two by emphasizing resource interactions: acquisitions raise performance only when target and acquirer resources are complementary. Marketing–technology complementarity (strong-marketing acquirer, strong-technology target) creates value, whereas technology–technology overlap is substitutive and can destroy it. The apparent contradiction in the literature thus dissolves into a moderation structure—average effects are uninformative when complementarity varies across deals.
25.5.2 Firm Boundaries: Franchising and External Knowledge
Firms also reshape their innovation capacity by reconfiguring their boundaries. Mallapragada and Srinivasan (2017) study franchising as such a lever, using panel data on 38 U.S. restaurant chains (1992–2005) and a nonlinear seemingly-unrelated- regression model. They find a positive relationship between franchising emphasis and product innovativeness that intensifies under high financial leverage and weakens under high slack resources, with a parallel but distinctly moderated pattern for process innovativeness. Franchising, on this evidence, is a conditional substitute for alliances and joint ventures in shaping innovation outcomes.
Knowledge also enters the firm through less formal channels. Baruffaldi and Poege (2024) show that firms learn at scientific conferences, especially when they engage intensely through both sponsorship and scientific contribution. Using direct flights as an instrumental variable for attendance—an instrument that shifts the cost of attending without plausibly affecting innovation through other channels—they find that co-attendance with other scientists raises the likelihood of leveraging external knowledge and of future collaboration, with learning skewed toward prominent firms and scientists. The instrument is what makes the learning claim causal rather than merely correlational: firms that attend more conferences differ in unobservable ways from those that do not, and direct flights break that confound.
25.5.3 Dominance, Radicalness, and the Competition–Innovation Curve
Who produces radical innovation—and who profits from it? Sorescu, Chandy, and Prabhu (2003) find that dominant firms introduce fewer radical innovations than non-dominant firms, that the financial rewards to radical innovation vary enormously across firms and are tied to the resource base, and that firms with deeper marketing and technology support and broader product portfolios extract more value from the radical innovations they do produce. The relationship between competition and innovation is itself non-monotonic: Aghion et al. (2005) establish an inverted-U, in which innovation is highest at intermediate product-market competition—too little competition removes the spur to innovate, too much removes the rents that reward it.
The contrast between dominant and entrant innovators is sharpened by what happens to a firm’s innovation after it goes public. Wies and Moorman (2015) show that following an initial public offering (IPO), firms raise their innovation levels—they innovate more—but the innovations become less risky, with fewer breakthroughs, as the discipline of public markets tilts the portfolio toward incremental safety. This post-IPO retreat from radicalness is the empirical hinge connecting the organizational and financial halves of the chapter.
25.6 Innovation and Firm Value
Innovation is ultimately an intangible asset, and capital markets price it. The marketing–finance literature—developed in full in Chapter 23—asks how investors value innovation activity and treats the question with event-study and asset-pricing machinery rather than survey scales.
25.6.1 How Markets Price New-Product Activity
S. Srinivasan et al. (2009) provide the foundational empirical link between product innovation, marketing investment, and stock returns. Their headline magnitudes are striking and worth stating precisely: investors react far more favorably to pioneering innovations than to minor updates—on the order of seven times greater—and the advertising support behind pioneering innovations is roughly nine times more effective in moving returns. Perceived product quality raises returns, while price promotions lower them, plausibly because a promotion signals weak underlying demand. The asymmetry between pioneering and incremental innovation is the financial counterpart to the radical-versus-incremental distinction in Sorescu, Chandy, and Prabhu (2003).
The effect of innovation on sales is itself conditioned by brand assets. Rebecca J. Slotegraaf and Pauwels (2008) show that the permanent and cumulative sales effects of product introductions are larger for brands with higher equity and more frequent releases, while lower-equity brands benefit more from each individual introduction—a substitution between brand stock and product flow. Collaboration timing also moves markets: Q. Wu et al. (2015) analyze 831 announcements of horizontal collaborations (partnering with competitors for NPD) over twelve years and find that markets react positively to collaboration at the initiation phase but negatively during development and commercialization, with the new product’s innovativeness and the partner’s relative strengths providing asymmetric moderation.
25.6.2 Innovation Signaling at the IPO
Innovation is informative precisely when information is scarcest—at the IPO, when outside investors know least about firm quality. Cao et al. (2022) show that firms deploy their innovation potential as a credible quality signal at IPO: innovation potential is positively associated with the IPO’s initial value and first-day returns and negatively associated with the extent of insider share sales. The components differ in what they signal—patents weigh most heavily on insider selling, while preannouncements move first-day returns most—consistent with a signaling logic in which costlier, harder-to-fake signals (granted patents) carry the most weight where credibility matters most.
25.6.3 Sustaining Innovation After the IPO
The post-IPO innovation decline documented by Wies and Moorman (2015) raises the question of what can arrest it. L. Wu, Lou, and Hitt (2024) examine the role of AI analytics in sustaining post-IPO innovation, analyzing patent data from over 1,000 publicly traded firms. Firms that acquire AI-analytics capabilities after their IPO suffer a smaller decline in innovation quality, with the effect concentrated in machine-learning capabilities specifically. The mechanism is recombination: sustained innovation is driven by the ability to recombine existing technologies into new ones—exactly the backward-citation logic of Section 25.3—and AI analytics supports that recombination. It mitigates two of the three classic barriers to post-IPO innovation—short-term financial pressure and disclosure requirements (with the disclosure benefit largest for firms with long product cycles)—while doing little for managerial-incentive problems. The broader lesson is that technology is itself an input into the production of innovation, and that firms and investors can partially offset the predictable post-IPO innovation slump by investing in it.
25.7 Key Takeaways
Diffusion is the formal backbone of innovation forecasting. The Bass model (Equation 25.1, Equation 25.2) decomposes adoption into innovation (\(p\)) and imitation (\(q\)); its parameters are weakly identified before the sales peak, and successive-generation extensions (Chandrasekaran, Tellis, and James 2020) are needed when substitution, not saturation, drives an incumbent’s decline.
Patent citations are the field’s default innovation measure: backward citations proxy (inverse) novelty and are available ex ante, while forward citations proxy importance but accrue ex post and require truncation corrections (Table 25.1).
Markets price innovation asymmetrically—pioneering innovations earn roughly seven times the reaction of incremental ones (S. Srinivasan et al. 2009)—and the post-IPO retreat from radical innovation (Wies and Moorman 2015) can be partly offset by technology investment (L. Wu, Lou, and Hitt 2024). The valuation machinery is developed in Chapter 23.
Aghion, P., N. Bloom, R. Blundell, R. Griffith, and P. Howitt. 2005. “Competition and Innovation: An Inverted-U Relationship.”The Quarterly Journal of Economics 120 (2): 701–28. https://doi.org/10.1093/qje/120.2.701.
Ahuja, Gautam, and Curba Morris Lampert. 2001. “Entrepreneurship in the Large Corporation: A Longitudinal Study of How Established Firms Create Breakthrough Inventions.”Strategic Management Journal 22 (6-7): 521–43.
Amabile, Teresa M., Phyllis Goldfarb, and Shereen C. Brackfleld. 1990. “Social Influences on Creativity: Evaluation, Coaction, and Surveillance.”Creativity Research Journal 3 (1): 6–21. https://doi.org/10.1080/10400419009534330.
Baruffaldi, Stefano, and Felix Poege. 2024. “Like Stars: How Firms Learn at Scientific Conferences.”Management Science.
Cao, Zixia, Reo Song, Alina Sorescu, and Ansley Chua. 2022. “EXPRESS: Innovation Potential, Insider Sales, and IPO Performance: How Firms Can Mitigate the Negative Effect of Insider Selling.”Journal of Marketing, 00222429221134489.
———. 2023. “Innovation Potential, Insider Sales, and IPO Performance: How Firms Can Mitigate the Negative Effect of Insider Selling.”Journal of Marketing 87 (4): 550–74.
Chandrasekaran, Deepa, Gerard J. Tellis, and Gareth M. James. 2020. “Leapfrogging, Cannibalization, and Survival During Disruptive Technological Change: The Critical Role of Rate of Disengagement.”Journal of Marketing, December, 002224292096791. https://doi.org/10.1177/0022242920967912.
Chandy, Rajesh, Brigitte Hopstaken, Om Narasimhan, and Jaideep Prabhu. 2006. “From Invention to Innovation: Conversion Ability in Product Development.”Journal of Marketing Research 43 (3): 494–508.
Chang, Ching-Hung, and Qingqing Wu. 2021. “Board Networks and Corporate Innovation.”Management Science 67 (6): 3618–54.
Galasso, Alberto, and Timothy S Simcoe. 2011. “CEO Overconfidence and Innovation.”Management Science 57 (8): 1469–84.
Grewal, Rajdeep, Murali Chandrashekaran, Jean L Johnson, and Girish Mallapragada. 2013. “Environments, Unobserved Heterogeneity, and the Effect of Market Orientation on Outcomes for High-Tech Firms.”Journal of the Academy of Marketing Science 41: 206–33.
Harz, Nathalie, Sebastian Hohenberg, and Christian Homburg. 2021. “Virtual Reality in New Product Development: Insights from Prelaunch Sales Forecasting for Durables.”Journal of Marketing 86 (3): 157–79. https://doi.org/10.1177/00222429211014902.
Hitt, Michael A., Robert E. Hoskisson, R. Duane Ireland, and Jeffrey S. Harrison. 1991. “Are Acquisitions a Poison Pill for Innovation?”Academy of Management Perspectives 5 (4): 22–34. https://doi.org/10.5465/ame.1991.4274745.
Ho-Dac, Nga N, Minu Kumar, and Rebecca J Slotegraaf. 2020. “Using Product Development Information to Spur the Adoption of Continuous Improvement Products.”Journal of the Academy of Marketing Science 48: 1156–73.
Kim, Yuna, and Rebecca J Slotegraaf. 2016. “Brand-Embedded Interaction: A Dynamic and Personalized Interaction for Co-Creation.”Marketing Letters 27: 183–93.
King, David R, Rebecca J Slotegraaf, and Idalene Kesner. 2008. “Performance Implications of Firm Resource Interactions in the Acquisition of r&d-Intensive Firms.”Organization Science 19 (2): 327–40.
Lampe, Ryan, and Petra Moser. 2016. “Patent Pools, Competition, and Innovation—Evidence from 20 US Industries Under the New Deal.”The Journal of Law, Economics, and Organization 32 (1): 1–36.
Luo, Lan, PK Kannan, and Brian T Ratchford. 2007. “New Product Development Under Channel Acceptance.”Marketing Science 26 (2): 149–63.
Mallapragada, Girish, and Raji Srinivasan. 2017. “Innovativeness as an Unintended Outcome of Franchising: Insights from Restaurant Chains.”Decision Sciences 48 (6): 1164–97.
Meade, Phillip T., and Luis Rabelo. 2004. “The Technology Adoption Life Cycle Attractor: Understanding the Dynamics of High-Tech Markets.”Technological Forecasting and Social Change 71 (7): 667–84. https://doi.org/10.1016/j.techfore.2004.01.008.
Mishra, Saurabh, and Rebecca J Slotegraaf. 2013. “Building an Innovation Base: Exploring the Role of Acquisition Behavior.”Journal of the Academy of Marketing Science 41: 705–21.
Molner, Sven, Jaideep C. Prabhu, and Manjit S. Yadav. 2018. “Lost in a Universe of Markets: Toward a Theory of Market Scoping for Early-Stage Technologies.”Journal of Marketing 83 (2): 37–61. https://doi.org/10.1177/0022242918813308.
Moorman, Christine, and Rebecca J Slotegraaf. 1999. “The Contingency Value of Complementary Capabilities in Product Development.”Journal of Marketing Research 36 (2): 239–57.
Roach, Michael, and Wesley M Cohen. 2013. “Lens or Prism? Patent Citations as a Measure of Knowledge Flows from Public Research.”Management Science 59 (2): 504–25.
Sethi, Rajesh, Daniel C Smith, and C Whan Park. 2001. “Cross-Functional Product Development Teams, Creativity, and the Innovativeness of New Consumer Products.”Journal of Marketing Research 38 (1): 73–85.
Slotegraaf, Rebecca J, and Kwaku Atuahene-Gima. 2011. “Product Development Team Stability and New Product Advantage: The Role of Decision-Making Processes.”Journal of Marketing 75 (1): 96–108.
Slotegraaf, Rebecca J., and Koen Pauwels. 2008. “The Impact of Brand Equity and Innovation on the Long-Term Effectiveness of Promotions.”Journal of Marketing Research 45 (3): 293–306. https://doi.org/10.1509/jmkr.45.3.293.
Sorescu, Alina B, Rajesh K Chandy, and Jaideep C Prabhu. 2003. “Sources and Financial Consequences of Radical Innovation: Insights from Pharmaceuticals.”Journal of Marketing 67 (4): 82–102.
Srinivasan, Raji, Stefan Wuyts, and Girish Mallapragada. 2018. “Corporate Board Interlocks and New Product Introductions.”Journal of Marketing 82 (1): 132–48.
Srinivasan, Shuba, Koen Pauwels, Jorge Silva-Risso, and Dominique M Hanssens. 2009. “Product Innovations, Advertising, and Stock Returns.”Journal of Marketing 73 (1): 24–43. https://doi.org/10.1509/jmkg.73.1.24.
Tellis, Gerard J, Jaideep C Prabhu, and Rajesh K Chandy. 2009. “Radical Innovation Across Nations: The Preeminence of Corporate Culture.”Journal of Marketing 73 (1): 3–23.
Trajtenberg, Manuel. 1990. “A Penny for Your Quotes: Patent Citations and the Value of Innovations.”The Rand Journal of Economics, 172–87.
Urban, Glen L., John R. Hauser, and John H. Roberts. 1990. “Prelaunch Forecasting of New Automobiles.”Management Science 36 (4): 401–21. https://doi.org/10.1287/mnsc.36.4.401.
Wies, Simone, and Christine Moorman. 2015. “Going Public: How Stock Market Listing Changes Firm Innovation Behavior.”Journal of Marketing Research 52 (5): 694–709. https://doi.org/10.1509/jmr.13.0289.
Wies, Simone, Christine Moorman, and Rajesh K Chandy. 2023. “Innovation Imprinting: Why Some Firms Beat the Post-Ipo Innovation Slump.”Journal of Marketing 87 (2): 232–52.
Wu, Lynn, Bowen Lou, and Lorin M Hitt. 2024. “Innovation Strategy After IPO: How AI Analytics Spurs Innovation After IPO.”Management Science.
Wu, Qingsheng, Xueming Luo, Rebecca J Slotegraaf, and Jaakko Aspara. 2015. “Sleeping with Competitors: The Impact of NPD Phases on Stock Market Reactions to Horizontal Collaboration.”Journal of the Academy of Marketing Science 43: 490–511.
You, Ya, Shuba Srinivasan, Koen Pauwels, and Amit Joshi. 2020. “How CEO/CMO Characteristics Affect Innovation and Stock Returns: Findings and Future Directions.”Journal of the Academy of Marketing Science 48 (6): 1229–53. https://doi.org/10.1007/s11747-020-00732-4.
Source Code
# Innovation {#sec-innovation}Innovation is the engine of long-run growth in marketing, and it is also one ofthe field's hardest objects to measure and to manage. A new product is a bet:the firm commits resources today against an uncertain stream of future demand,and the value of that bet is realized—or destroyed—through the joint behavior ofconsumers (who must adopt), competitors (who respond), and capital markets (whoprice the firm's prospects long before the cash arrives). This chapter treatsinnovation as the connective tissue between three literatures that are often readseparately: the **diffusion** of new technologies through a population ofadopters, the **organizational and strategic** determinants of who innovates andhow much, and the **financial** valuation of innovation as an intangible asset.The chapter is organized around the life of an innovation. It begins with*diffusion*—the canonical models of how an installed base accumulates overtime—because diffusion supplies the formal backbone on which forecasting,substitution, and life-cycle tracking are built. It then turns to *measurement*:how researchers quantify a construct that has no natural unit, leaning heavily onthe patent-citation machinery that the empirical literature has standardized. Withconstructs and measures in hand, it examines the *new-product-development* (NPD)process inside the firm—teams, capabilities, channels, co-creation, andgovernance—and the *organizational* forces (acquisitions, franchising, goingpublic) that expand or erode a firm's capacity to innovate. It closes with the*marketing–finance* linkage, where innovation is priced by investors and theconstruct is finally expressed in returns. Throughout, intuition leads and theformalism follows in full: a reader should leave able to specify a diffusionmodel, defend a patent-based innovation measure against its known biases, andreason about why markets reward some innovations seven times more than others.By the end of the chapter the reader will be able to (i) write down and estimatethe Bass diffusion model and its successive-generation extension, (ii) constructand critique patent-based innovation measures, and (iii) connect new-productactivity to firm value through the event-study logic developed at length in@sec-marketing-finance.## Theoretical Foundations {#sec-innovation-theory}Before the formal diffusion machinery, it is worth naming the theories that givethat machinery its behavioral content. Four strands govern how an innovation spreadsand why some spread faster than others.**Diffusion of innovations**, in Rogers's classic synthesis, describes adoption as aprocess unfolding through communication channels over time across adopter categories:innovators, early adopters, early majority, late majority, and laggards. The**Bass model** [@Bass_1969] is the formal, estimable expression of exactly this idea:its coefficient of innovation $p$ captures Rogers's external-influence (media,advertising) channel and its coefficient of imitation $q$ captures the internal,word-of-mouth contagion among prior adopters, as developed in @eq-04-bass-hazard.Rogers supplies the sociology; Bass supplies the differential equation.**The technology acceptance model** (TAM), Davis's adaptation of the theory ofreasoned action to information technology, holds that adoption intention is driven bytwo beliefs: perceived usefulness and perceived ease of use. TAM explains adoption atthe level of the *individual* decision that the Bass model aggregates, and it is themicrofoundation most often invoked when the innovation is a digital product orplatform.**Rogers's perceived attributes** explain the *rate* of diffusion, that is, why theBass $p$ and $q$ differ so sharply across categories. Five attributes predict adoptionspeed: **relative advantage** (the improvement over what it replaces),**compatibility** (fit with existing values and practices), **complexity** (inverseease of understanding and use), **trialability** (the degree to which it can beexperimented with before commitment), and **observability** (the visibility of itsbenefits to others). High relative advantage, compatibility, trialability, andobservability, and low complexity, accelerate diffusion. These attributes are thebehavioral content behind an otherwise atheoretical $q/p$ ratio.**Network effects** modify the diffusion logic for products whose value to eachadopter rises with the size of the installed base (communication platforms,standards, marketplaces). Under direct or indirect network externalities theimitation channel is not merely informational but *value-creating*: each new adopterraises the relative advantage of adoption for everyone else, which steepens theS-curve, can produce tipping and winner-take-most outcomes, and connects diffusion tothe platform dynamics treated elsewhere in the book.## Diffusion of InnovationsDiffusion is the process by which an innovation spreads through a population ofpotential adopters over time. The central empirical regularity is that cumulativeadoption traces an **S-curve**: slow at first, accelerating as word spreads, thensaturating as the pool of non-adopters is exhausted. The modeling task is to givethis curve a behavioral micro-foundation so that its parameters carry meaning andcan be used for forecasting.### The Bass ModelThe workhorse is the Bass model [@Bass_1969]. Its premise is that the propensityto adopt at time $t$, conditional on not having adopted yet, is a linear functionof how many others have already adopted. Let $F(t)$ be the cumulative fraction ofthe market that has adopted by time $t$, and let $h(t)$ denote the **hazard**—theconditional rate of first adoption among those who have not yet adopted. The Bassspecification is$$h(t) \;=\; \frac{f(t)}{1 - F(t)} \;=\; p + q\,F(t),$$ {#eq-04-bass-hazard}where $f(t) = F'(t)$ is the adoption density. The two parameters carry distinctbehavioral content. The **coefficient of innovation** $p$ captures the tendency toadopt independently of social influence—external pressure from advertising, media,or intrinsic need—and governs the *level* of the curve at $t=0$. The**coefficient of imitation** $q$ captures adoption driven by social contagion—wordof mouth, observation, network effects—and governs the *acceleration* once earlyadopters seed the population. A scale parameter $m$, the ultimate **marketpotential**, converts the fraction $F(t)$ into a count of adopters $N(t) = m\,F(t)$.> The Bass model partitions adopters into *innovators*, who adopt under external> influence captured by $p$, and *imitators*, whose adoption probability rises> linearly with the cumulative number of previous adopters, captured by $q$> [@Bass_1969].Substituting $f(t) = h(t)\bigl(1 - F(t)\bigr)$ into @eq-04-bass-hazard yields theordinary differential equation $f(t) = \bigl(p + qF(t)\bigr)\bigl(1 - F(t)\bigr)$,whose solution under $F(0)=0$ is the closed form$$F(t) \;=\; \frac{1 - e^{-(p+q)t}}{1 + \tfrac{q}{p}\,e^{-(p+q)t}}.$$ {#eq-bass-cumulative}The non-cumulative adoption rate $n(t) = m\,f(t)$ is hump-shaped whenever $q > p$,peaking at $t^{\*} = \tfrac{1}{p+q}\ln(q/p)$; when $q \le p$ adoption declinesmonotonically from launch and the S-curve degenerates. The interior peak is whatgives durable-goods sales their characteristic rise-and-fall, and the location ofthat peak is the quantity managers most want to forecast.**Estimation.** The original approach regresses discrete-time adoptions on theinstalled base. Writing $n_t = m f(t)$ and $N_{t-1} = m F(t-1)$, the discretizedanalogue of @eq-04-bass-hazard is the quadratic$$n_t \;=\; p\,m \;+\; (q - p)\,N_{t-1} \;-\; \frac{q}{m}\,N_{t-1}^{2} \;+\; u_t\;=\; \beta_0 + \beta_1 N_{t-1} + \beta_2 N_{t-1}^{2} + u_t,$$ {#eq-04-bass-ols}which is linear in the composite parameters $\beta_0, \beta_1, \beta_2$ and can beestimated by ordinary least squares (OLS). The structural parameters are thenrecovered by inversion: $m$ solves $\beta_2 m^2 + \beta_1 m + \beta_0 = 0$ (takingthe positive root), $p = \beta_0/m$, and $q = -\beta_2 m$. OLS on@eq-04-bass-ols is consistent only under strong assumptions, and three failures ofidentification recur in practice. First, $N_{t-1}$ is mechanically correlated withthe error $u_t$ when adoption shocks are serially correlated, biasing thecoefficients—maximum likelihood or nonlinear least squares on @eq-bass-cumulativeis preferred. Second, the parameters are weakly identified before the sales peak:without observations on both sides of $t^{\*}$, $m$ and $q$ trade off and estimatesare unstable, which is why early-life forecasts are notoriously fragile. Third, thebasic model assumes a *fixed* market potential and *constant* $p, q$; in realitymarketing-mix variables, price declines, and successive product generations allshift these quantities, motivating the extensions below. @fig-bass-curve plots thecumulative S-curve alongside the hump-shaped adoption rate it implies.```{r bass-curve, message=FALSE, warning=FALSE}#| label: fig-bass-curve#| fig-cap: "Bass diffusion: cumulative adoption F(t) and the hump-shaped adoption#| rate n(t) for p = 0.03, q = 0.38, m = 1. The adoption rate peaks at the#| inflection point of the S-curve."set.seed(1969)p <-0.03; q <-0.38; m <-1t <-seq(0, 25, by =0.1)F_t <- (1-exp(-(p + q) * t)) / (1+ (q / p) *exp(-(p + q) * t))f_t <- (p + q * F_t) * (1- F_t) # adoption density n(t)/mt_peak <-log(q / p) / (p + q)op <-par(mar =c(4, 4, 2, 4))plot(t, F_t, type ="l", lwd =2, ylim =c(0, 1),xlab ="Time since launch", ylab ="Cumulative fraction F(t)")par(new =TRUE)plot(t, f_t, type ="l", lwd =2, lty =2, col ="grey40",axes =FALSE, xlab ="", ylab ="")axis(4); mtext("Adoption rate n(t)/m", side =4, line =2.5)abline(v = t_peak, col ="red", lty =3)legend("topleft", legend =c("Cumulative F(t)", "Rate n(t)/m", "Peak"),lty =c(1, 2, 3), lwd =c(2, 2, 1),col =c("black", "grey40", "red"), bty ="n")par(op)```### Successive Generations and SubstitutionMost durable categories do not diffuse once; they diffuse repeatedly as newtechnological generations replace old ones (mainframes to minicomputers to PCs;3G to 4G to 5G). A model of a *single* generation misattributes the decline of anincumbent technology to saturation when it is in fact substitution. @Chandrasekaran_2020develop a successive-generations framework that separates two rates the basic Bassmodel conflates: the rate at which adopters **disengage** from an older technologyand the rate at which they **adopt** the newer one. Allowing these to differ iswhat lets the model fit the empirically observed overlap, in which an oldergeneration is still gaining late adopters even as the newer one accelerates—anoverlap a single substitution rate cannot reproduce.The practical payoff is life-cycle tracking. @meade2004 review the forecastingtoolkit for the technology-adoption life cycle and stress that model choice shouldfollow the data regime: pre-peak data demand methods robust to the weakidentification noted above, whereas post-peak data permit richer multi-generationspecifications. The diffusion literature thus supplies not a single model but aladder of models indexed by how much of the life cycle the analyst can observe.@fig-successive-generations sketches how each generation carries its own adoptionprocess while a distinct disengagement rate governs substitution.```{mermaid}%%| label: fig-successive-generations%%| fig-cap: "Successive-technology diffusion. Each generation has its own adoption%%| process; substitution is governed by a disengagement rate from the incumbent%%| that is distinct from the adoption rate of the successor."flowchart LR NP["Non-adopters<br/>(market potential m)"] -->|"adopt Gen 1<br/>(p₁, q₁)"| G1["Gen 1<br/>installed base"] G1 -->|"disengage"| SW["Switching pool"] NP -->|"adopt Gen 2<br/>(p₂, q₂)"| G2["Gen 2<br/>installed base"] SW -->|"upgrade"| G2 G2 -->|"disengage"| G3["Gen 3 …"]```## Measuring Innovation {#sec-innovation-measure}Innovation has no natural unit, so every empirical claim about it rests on aconstructed measure, and the credibility of the claim is only as strong as themeasure's construct validity. Three families dominate. **Input** measures (R&Dexpenditure) capture effort but not outcome and are reported inconsistently acrossfirms. **Output** measures based on new-product introductions—drawn fromcommercial databases such as product-launch analytics [@wies2023innovation]—capturecommercialized innovation but miss the upstream invention that precedes it.**Patent-based** measures sit between input and market outcome and have become thefield's default because patents are dated, classified, linked to assignees, andconnected to one another through citations.### Patent Counts and Their Truncation ProblemsThe canonical pipeline, exemplified by @chang2021board, draws granted-patentrecords (historically from the NBER patent database covering U.S. Patent andTrademark Office grants) and proxies a firm's annual innovation by two quantities:the **count** of patents the firm applied for in a year and ultimately had granted,and the **citations** those patents subsequently receive. Two measurementdecisions are load-bearing. First, patents are dated by *application* year ratherthan grant year, because application date is closer to the moment of inventiveactivity. Second, both measures are logged to tame the heavy right tail of thepatent distribution.Two truncation biases must be corrected or the estimates are not interpretable.The **application–grant lag** truncates recent application years (patents appliedfor late in the sample have not yet been granted), so the sample is typicallyended a few years before the data cutoff. The **citation-accumulation lag**truncates forward citations for recent patents (they have had less time to becited), which is addressed with technology-class-by-year fixed effects that net outthe systematic component of citation timing. These are not cosmetic adjustments:without them, a spurious downward trend in innovation appears at the end of everysample.### Backward Citations: NoveltyA patent cites *prior art*. The **backward** citations a patent makes—the patentsit builds on—index how much existing knowledge it recombines, and thus inverselyindex its novelty.> Citing propensity is defined as the average number of backward citations> excluding citations to public research per patent; it reflects a firm's overall> level of citing [@roach2013lens, p. 512].@chandy2006invention use the same logic at the patent level: novelty is measuredby the number of backward citations a patent makes, with *higher* backwardcitations implying *lower* novelty, on the reasoning that an idea drawing heavilyon existing patents is by construction less of a departure from what came before.Backward counts are available at application time, which makes them attractive asan *ex ante* measure—unlike the forward citations discussed next.### Forward Citations: ImportanceThe **forward** citations a patent receives—later patents that cite it—index itsdownstream influence, and the literature treats them as the best available proxyfor the *importance* or *quality* of an invention rather than its mere volume.@tellis2009radical and @cao2023innovation both weight patents by forward citationson precisely this ground, and @ahuja2001entrepreneurship operationalize**breakthrough** inventions as the top 1% of patents by citation weight withintheir application year. The external validity of the measure is anchored by@trajtenberg1990penny, who shows that the more citations a CT-scanner patentreceives, the higher its correlation with the technology's realized improvementsurplus—a rare direct link between a citation count and an independent welfaremeasure [@lampe2016patent]. @chandy2006invention summarize idea *importance* as thetotal forward-citation count for a patent.Forward citations have well-understood virtues and a sharp limitation, which thefollowing table organizes.| Property | Forward citations | Backward citations ||---|---|---|| Construct measured | Importance / quality / influence | Novelty (inverse) || Timing | *Ex post* (accrue after grant) | *Ex ante* (fixed at application) || Manipulability by firm | Low—examiners verify prior art; over-citing narrows own scope | Higher—applicants control what they cite || Principal bias | Right-truncation: older patents accrue more citations | Less time-sensitive || Standard fix | Long window (≈17+ yrs) or class-year fixed effects | — |: Forward versus backward patent citations as innovation measures {#tbl-citations}As @tbl-citations records, the chief threat to forward-citation measures is**temporal**: because citations accrue over time, older patents mechanically lookmore important. The standard remedy is a citation window long enough—on the orderof seventeen years or more—that the bias from differential accumulation isnegligible, supplemented by the class-year fixed effects noted above. The*ex post* nature of the measure remains a genuine caveat: forward citations cannotrecover the importance an inventor or investor could have perceived *at the time*of patenting, which is exactly the quantity a forward-looking valuation would want.@galasso2011ceo exploit this measurement apparatus to study how managerial riskexposure shapes the quantity and the citation-weighted quality of innovation.## New Product DevelopmentA diffusion curve and a patent count describe innovation from the outside. Insidethe firm, innovation is produced by **new-product-development** processes whosedesign—who is on the team, what information they have, how decisions are made—shapeswhether the resulting product is innovative enough to survive. The recurringfinding is that NPD outcomes are *contingent*: capabilities and team structureshave value not in the abstract but conditional on the informational andcompetitive environment.### Capabilities, Teams, and the Information Environment@moorman1999contingency advance a contingency view of NPD capability. Rather thanasking whether technological and marketing capabilities raise performance onaverage, they ask *when*: the informational content of the external environmentmodulates how firms deploy their capabilities, affecting both the magnitude and thepace of product development. The value of a capability, on this account, lies inits adaptive deployment against environmental cues, not in its mere existence—atheme that recurs across the NPD literature.Team composition is the next lever. @sethi2001cross study cross-functional NPDteams and locate the primary cause of new-product failure in a *lack ofinnovativeness*, defined as the delivery of uniquely meaningful benefits.Innovativeness rises with a strong superordinate team identity, encouragement totake risks, customer influence, and active senior-management monitoring—but it*falls* with high social cohesion, because cohesive teams suppress the dissent thatgenerates novel options. The interactions are as important as the main effects: thebenefit of a superordinate identity is amplified by risk encouragement and dampedby social cohesion, while functional diversity per se does not move innovativeness.The emphasis on risk encouragement echoes a robust finding from the creativityliterature, that the *expectation of evaluation* lowers creative output[@amabile1990]: teams that anticipate being judged retreat to safe, conventionaloptions, which is precisely the suppression of novelty that underminesinnovativeness.@slotegraaf2011product add a temporal dimension, showing that the relationshipbetween team **stability** and the comprehensiveness of decision making is*curvilinear*—too little stability fragments knowledge, too much breedscomplacency—and that decision comprehensiveness improves new-product advantage,especially at its upper range.A structural caution runs through this literature. @grewal2013environments showthat the often-mixed findings on how market orientation interacts with theenvironment can reflect **unobserved heterogeneity**: estimating finite-mixture(latent-class) regressions reveals multiple regimes with different effect signs, sothat pooled estimates suffer aggregation bias. The methodological lessongeneralizes—latent heterogeneity in firms' innovation responses can masquerade as anull or unstable average effect, and disaggregated estimation is the corrective.### Channels, Co-creation, and ForecastingNPD does not end at the factory gate. @luo2007new examine new-product developmentunder the constraint of **channel acceptance**, recognizing that a product thatretailers will not stock cannot diffuse regardless of consumer appeal.@ho2020using study **continuous-improvement products** (CIPs)—products engineeredfor post-purchase improvement rather than full replacement—and show that sharing*development-progress* information raises adoption of the current version, mediatedby consumers' perception of the developer's commitment to ongoing improvement andmoderated by product familiarity. Disclosure, in other words, is itself a marketinginstrument.On the demand-sensing side, @kim2016brand challenge the static view of consumerco-creation. Their concept of **brand-embedded interaction**—dynamic, personalizedengagement that steers consumers toward ideas satisfying both their own needs andthe brand's aspirations—yields more *constructive* NPD ideas in two Twitter-basedquasi-field experiments than passive solicitation does. Co-creation quality, thatis, is endogenous to how the firm structures the interaction.Forecasting a durable good *before* launch is the hardest demand-sensing problem,because there is no sales history to extrapolate. @harz2021 deploy **virtualreality** (VR) for prelaunch sales forecasting of durables, arguing that VR's*visualization* capability (simulation scope, similarity to reality, immersion) and*automated-tracking* capability (interactivity) induce behavioral consistencybetween participants' information search, stated preferences, and purchase behavior.The forecasting backbone is the **macro-flow model** (@fig-macro-flow), which projects new-productsales over time by specifying a set of behavioral states (awareness, preference,purchase), the flows between them, and the determinants of those flows[@urban1990]. @harz2021 extend this model with VR-derived virtual purchases andthird-party awareness inputs and find improved accuracy—after adjusting foradvertising—at both aggregate and individual levels, with *presence* and *vividness*as the operative psychological mechanisms.```{mermaid}%%| label: fig-macro-flow%%| fig-cap: "The macro-flow model underlying prelaunch forecasting: consumers flow%%| through behavioral states, and the model estimates the determinants of each%%| transition. Virtual-reality simulations supply the flow inputs before launch%%| [@urban1990; @harz2021]."flowchart LR A["Aware"] -->|"info search"| K["Knowledgeable /<br/>Preference formed"] K -->|"intend"| I["Purchase intent"] I -->|"trial / virtual purchase"| P["Purchase"] P -->|"satisfaction"| R["Repeat / WOM"] R -.->|"contagion"| A```### Governance and Organizational StructureInnovation is governed from the top of the firm. @srinivasan2018corporate study**board interlock centrality**—how connected a firm's directors are to otherboards—and find it raises incremental new-product introductions by channelingmarket intelligence into the firm; the effect strengthens with internal andmarketing leadership on the board and with a CEO of marketing background, andweakens under pronounced intra-industry external leadership. @you2020 push theupper-echelons logic further, showing that CEO and CMO characteristics—personality,demographics, experience, values—shape both innovation and the stock returns itgenerates. At the front end of strategy, @molner2018 show that managers' **market-scoping mindset** conditions which markets an innovation reaches: ambiguity*avoidance* pulls managers toward a downstream, end-user orientation that courtscommercialization failure, whereas ambiguity *acceptance* fosters an upstreamorientation that uncovers viable market spaces.## Organizational Determinants of InnovationBeyond the project and the boardroom lies the question of which *organizational*arrangements expand or erode a firm's stock of innovative capacity—what severalauthors call its **innovation base**, the accumulated inventions, ideas, anddiscoveries that propel future innovation.### Acquisitions and the Innovation BaseThe evidence on whether acquisitions help or harm innovation is genuinely mixed,and the resolution is conditional. @hitt1991 document a *negative* average effect:acquisition activity reduces R&D inputs and outputs, including patent counts, asmanagerial attention and capital are absorbed by integration. @mishra2013building,analyzing 352 firms across five industries over seventeen years, qualify this:firms that acquire build a *more* robust innovation base than those that do not,but the benefit depends on the **type** of acquisition—vertical (across supply-chainstages) versus horizontal (same stage, similar chains)—and, critically, on the**breadth of knowledge** in the acquiring firm, which determines whether eitheracquisition type actually enriches the base. @king2008performance reconcile thetwo by emphasizing **resource interactions**: acquisitions raise performance onlywhen target and acquirer resources are *complementary*. Marketing–technologycomplementarity (strong-marketing acquirer, strong-technology target) createsvalue, whereas technology–technology overlap is substitutive and can destroy it.The apparent contradiction in the literature thus dissolves into a moderationstructure—average effects are uninformative when complementarity varies acrossdeals.### Firm Boundaries: Franchising and External KnowledgeFirms also reshape their innovation capacity by reconfiguring their boundaries.@mallapragada2017innovativeness study **franchising** as such a lever, using paneldata on 38 U.S. restaurant chains (1992–2005) and a nonlinear seemingly-unrelated-regression model. They find a positive relationship between franchising emphasis and*product* innovativeness that intensifies under high financial leverage and weakensunder high slack resources, with a parallel but distinctly moderated pattern for*process* innovativeness. Franchising, on this evidence, is a conditional substitutefor alliances and joint ventures in shaping innovation outcomes.Knowledge also enters the firm through less formal channels. @baruffaldi2024likeshow that firms learn at **scientific conferences**, especially when they engageintensely through both sponsorship and scientific contribution. Using directflights as an instrumental variable for attendance—an instrument that shifts thecost of attending without plausibly affecting innovation through other channels—theyfind that co-attendance with other scientists raises the likelihood of leveragingexternal knowledge and of future collaboration, with learning skewed towardprominent firms and scientists. The instrument is what makes the learning claim*causal* rather than merely correlational: firms that attend more conferences differin unobservable ways from those that do not, and direct flights break thatconfound.### Dominance, Radicalness, and the Competition–Innovation CurveWho produces *radical* innovation—and who profits from it? @sorescu2003sources findthat **dominant** firms introduce *fewer* radical innovations than non-dominantfirms, that the financial rewards to radical innovation vary enormously across firmsand are tied to the resource base, and that firms with deeper marketing andtechnology support and broader product portfolios extract more value from theradical innovations they do produce. The relationship between competition andinnovation is itself non-monotonic: @aghion2005 establish an **inverted-U**, inwhich innovation is highest at intermediate product-market competition—too littlecompetition removes the spur to innovate, too much removes the rents that reward it.The contrast between dominant and entrant innovators is sharpened by what happens toa firm's innovation *after* it goes public. @Wies_2015 show that following aninitial public offering (IPO), firms raise their innovation *levels*—they innovatemore—but the innovations become *less risky*, with fewer breakthroughs, as thediscipline of public markets tilts the portfolio toward incremental safety. Thispost-IPO retreat from radicalness is the empirical hinge connecting theorganizational and financial halves of the chapter.## Innovation and Firm ValueInnovation is ultimately an intangible asset, and capital markets price it. Themarketing–finance literature—developed in full in @sec-marketing-finance—asks howinvestors value innovation activity and treats the question with event-study andasset-pricing machinery rather than survey scales.### How Markets Price New-Product Activity@srinivasan2009a provide the foundational empirical link between product innovation,marketing investment, and stock returns. Their headline magnitudes are striking andworth stating precisely: investors react far more favorably to **pioneering**innovations than to minor updates—on the order of *seven times* greater—and theadvertising support behind pioneering innovations is roughly *nine times* moreeffective in moving returns. Perceived product quality raises returns, while pricepromotions *lower* them, plausibly because a promotion signals weak underlyingdemand. The asymmetry between pioneering and incremental innovation is the financialcounterpart to the radical-versus-incremental distinction in @sorescu2003sources.The effect of innovation on sales is itself conditioned by brand assets.@slotegraaf2008 show that the permanent and cumulative sales effects of productintroductions are larger for brands with higher equity and more frequent releases,while lower-equity brands benefit *more* from each individual introduction—asubstitution between brand stock and product flow. Collaboration timing also movesmarkets: @wu2015sleeping analyze 831 announcements of **horizontal collaborations**(partnering with competitors for NPD) over twelve years and find that markets react*positively* to collaboration at the *initiation* phase but *negatively* duringdevelopment and commercialization, with the new product's innovativeness and thepartner's relative strengths providing asymmetric moderation.### Innovation Signaling at the IPOInnovation is informative precisely when information is scarcest—at the IPO, whenoutside investors know least about firm quality. @cao2022express show that firmsdeploy their **innovation potential** as a credible quality signal at IPO:innovation potential is positively associated with the IPO's initial value andfirst-day returns and negatively associated with the extent of insider share sales.The components differ in what they signal—patents weigh most heavily on insiderselling, while preannouncements move first-day returns most—consistent with asignaling logic in which costlier, harder-to-fake signals (granted patents) carrythe most weight where credibility matters most.### Sustaining Innovation After the IPOThe post-IPO innovation decline documented by @Wies_2015 raises the question of whatcan arrest it. @wu2024innovation examine the role of **AI analytics** in sustainingpost-IPO innovation, analyzing patent data from over 1,000 publicly traded firms.Firms that acquire AI-analytics capabilities after their IPO suffer a *smaller*decline in innovation quality, with the effect concentrated in machine-learningcapabilities specifically. The mechanism is **recombination**: sustained innovationis driven by the ability to recombine existing technologies into new ones—exactlythe backward-citation logic of @sec-innovation-measure—and AI analytics supportsthat recombination. It mitigates two of the three classic barriers to post-IPOinnovation—short-term financial pressure and disclosure requirements (with thedisclosure benefit largest for firms with long product cycles)—while doing littlefor managerial-incentive problems. The broader lesson is that *technology* is itselfan input into the production of innovation, and that firms and investors canpartially offset the predictable post-IPO innovation slump by investing in it.## Key Takeaways- Diffusion is the formal backbone of innovation forecasting. The **Bass model** (@eq-04-bass-hazard, @eq-bass-cumulative) decomposes adoption into innovation ($p$) and imitation ($q$); its parameters are weakly identified before the sales peak, and successive-generation extensions [@Chandrasekaran_2020] are needed when substitution, not saturation, drives an incumbent's decline.- Patent **citations** are the field's default innovation measure: backward citations proxy (inverse) novelty and are available *ex ante*, while forward citations proxy importance but accrue *ex post* and require truncation corrections (@tbl-citations).- NPD outcomes are **contingent**—on the information environment[@moorman1999contingency], team structure [@sethi2001cross; @slotegraaf2011product], and latent firm heterogeneity [@grewal2013environments]—so average effects mislead.- Acquisitions help innovation only under resource **complementarity**[@king2008performance; @mishra2013building], reconciling the otherwise-negative average effect [@hitt1991]; competition and innovation trace an inverted-U[@aghion2005].- Markets price innovation asymmetrically—pioneering innovations earn roughly seven times the reaction of incremental ones [@srinivasan2009a]—and the post-IPO retreat from radical innovation [@Wies_2015] can be partly offset by technology investment[@wu2024innovation]. The valuation machinery is developed in @sec-marketing-finance.