| Section | Words | Purpose | Default tense |
|---|---|---|---|
| Title | 8–15 | Name the contribution | — |
| Abstract | 200–250 | Self-contained summary: objective, method, finding, implication | Past + present |
| Introduction | 800–1200 | Why the paper exists; the gap and the contribution | Present + present perfect |
| Literature / Theory | 1500–3000 | Position vs. prior work; derive hypotheses or model | Present + present perfect |
| Methods | 1000–2500 | What was done, reproducibly | Past |
| Results | 1000–2500 | What was found, with the data doing the talking | Past + present |
| Discussion | 1500–2500 | What it means, limits, boundary conditions | Present + past |
| Conclusion | 400–800 | Restate contribution; implications and future work | Present |
75 Scientific Writing
A research paper is the instrument through which a discovery becomes knowledge. A result that is not written down does not exist scientifically; a result written badly exists only for the handful of readers willing to excavate it. This chapter treats scientific writing not as cosmetic polish applied after the “real” work but as an integral part of the research itself—a design problem with its own constraints, its own failure modes, and its own measurable quality. The audience is the marketing scholar who has a finding and now faces the harder task of convincing a skeptical editor, two or three adversarial reviewers, and an indifferent field that the finding is correct, novel, and important.
The economics of the situation are unforgiving. The top journals in marketing—the Journal of Marketing (JM), the Journal of Marketing Research (JMR), Marketing Science, and the Journal of Consumer Research (JCR), collectively the “top-4”—desk-reject a large share of submissions and ultimately accept only a small fraction of what is sent to them. A reviewer reads dozens of papers a year as unpaid labor and forms a judgment within the first few pages. The paper that survives is not merely the one with the best result; it is the one whose argument the reviewer can reconstruct without effort and whose contribution the reviewer can state in a sentence. Writing is therefore a competitive technology, and this chapter develops it as one.
The chapter proceeds from architecture to sentence. We begin with the structure of a paper—the canonical section sequence and what each section is for—and formalize the underlying logical scaffold. We then treat the hardest and most consequential task, framing the contribution, and then the two genres the hypo-deductive template serves badly—the descriptive paper, which contributes a pattern, and the abductive paper, which reasons from a pattern to the best available explanation. Next comes the part of the paper where framing lives or dies: the front end (title, abstract, introduction). We turn next to the specific demands of writing for the top-4, where the contribution bar is highest. We close with clarity and revision: the sentence-level craft that makes an argument legible, the measurement of readability, and the disciplined process of responding to reviewers. Throughout, the stance is the house stance— intuition first, then the formal structure that makes the intuition operational.
75.1 The Structure of a Paper
75.1.1 The canonical sections and their tenses
Empirical marketing papers share a near-universal skeleton, sometimes abbreviated IMRaD (Introduction, Methods, Results, and Discussion) with literature review and conclusions bracketing the core. Each section answers one question and only one, and—this is a point novices routinely miss—each section has a default verb tense that signals the epistemic status of its claims. Completed actions take the simple past (“we estimated”, “respondents rated”); established knowledge and the paper’s own ongoing argument take the present (“the effect is”, “Table 2 reports”); prior literature as a stream that continues into the present takes the present perfect (“researchers have shown”). Table 75.1 collects the sections, their purposes, approximate lengths, and tense conventions.
The discipline of one-question-per-section is what gives a paper its navigability. A reader who wants to know what you did turns to Methods and finds only that; a reader who wants to know why it matters turns to the Discussion and is not detained by procedure. Violations—results smuggled into the methods, mechanism speculation buried in the results—are the most common structural defect flagged in review, because they force the reader to hold the paper’s logic in their head rather than read it off the page.
A scientific paper is not a chronological record of what the researcher did. It is a reconstructed argument, organized so that the reader can verify the conclusion with minimum effort. The order of discovery and the order of exposition are different things, and conflating them is the surest route to an unreadable manuscript.
75.1.2 The argument as a logical object
Underneath the section skeleton sits a logical scaffold that the prose merely dresses. Make it explicit. A confirmatory empirical paper advances a chain
\[ \underbrace{P}_{\text{problem}} \;\Rightarrow\; \underbrace{G}_{\text{gap}} \;\Rightarrow\; \underbrace{H}_{\text{hypotheses}} \;\Rightarrow\; \underbrace{D}_{\text{design}} \;\Rightarrow\; \underbrace{R}_{\text{results}} \;\Rightarrow\; \underbrace{C}_{\text{contribution}} \tag{75.1}\]
in which every arrow is a claim the reader can refuse to grant. The problem \(P\) must be real (someone cares about the answer); the gap \(G\) must be genuine (the answer is not already known); the hypotheses \(H\) must follow from a theory and be falsifiable; the design \(D\) must be capable of discriminating \(H\) from its negation; the results \(R\) must actually bear on \(H\); and the contribution \(C\) must be what \(R\) licenses, not more. A paper fails at whichever arrow is weakest, and the writing task is to make each arrow as short and as forced as possible. Many rejections that are phrased as “not enough contribution” are in fact broken arrows: a gap that turns out to be already filled (\(G\)), or a design that cannot separate the focal hypothesis from a confound (\(D \not\Rightarrow R\)).
The conceptual or theory paper substitutes a different chain—a construct is defined, related to existing constructs, and shown to do explanatory work—but the demand for unbroken arrows is identical. Figure 75.1 renders the canonical flow and shows where each link in Equation 75.1 is forged.
flowchart TD
    A["Title<br/><i>names the contribution</i>"] --> B["Abstract<br/><i>P → R → C in 250 words</i>"]
    B --> C["Introduction<br/><i>problem P, gap G,<br/>promised contribution C</i>"]
    C --> D["Theory / Literature<br/><i>position; derive H</i>"]
    D --> E["Methods<br/><i>design D</i>"]
    E --> F["Results<br/><i>evidence R</i>"]
    F --> G["Discussion<br/><i>does R license C?</i>"]
    G --> H["Conclusion<br/><i>restate C; boundaries</i>"]
    C -.->|"promise"| G
    H -.->|"payoff"| C
    style C fill:#e8f0fe,stroke:#1a73e8
    style G fill:#e8f0fe,stroke:#1a73e8
The dashed promise–payoff loop in Figure 75.1 is the structural heart of a paper. The introduction makes a promise—“we will show that \(X\) causes \(Y\) through mechanism \(M\)”—and the discussion must redeem exactly that promise, no more and no less. A paper that promises a causal claim and delivers a correlation, or that delivers a richer finding than it promised and never updates the framing, reads as incoherent even when every individual sentence is sound.
75.1.3 Paper types
The skeleton flexes with the paper’s type, and naming the type early orients both writer and reviewer. Four types recur. A research paper tests hypotheses and reports findings; its contribution lives in \(H \Rightarrow R\). A methods paper proposes a new estimator, design, or measurement instrument; its contribution is that the method recovers something prior methods could not, so the burden is a demonstration—often on synthetic data with known ground truth—that it works and a comparison against incumbents. A review paper consolidates a domain, and its contribution is organization: a taxonomy, an integrative framework, or an agenda that practitioners and scholars did not previously have. A conceptual or discussion paper advances or critiques theory, trading empirical evidence for argumentative rigor. The reviewer evaluates each type against a different standard, and a paper that does not signal its type invites evaluation against the wrong one.
75.2 Framing the Contribution
75.2.1 What a contribution is
The single most important sentence in a paper is the one that states its contribution, and the most common reason good work is rejected is that this sentence is missing, vague, or overclaimed. Define the contribution formally. Let \(\mathcal{K}\) denote the field’s existing knowledge—the set of claims a competent reader already accepts before reading the paper. A paper’s contribution is the increment
\[ \Delta\mathcal{K} \;=\; \mathcal{K}_{\text{after}} \setminus \mathcal{K}_{\text{before}}, \tag{75.2}\]
the set of claims that a reader is licensed to accept after reading the paper and was not licensed to accept before. Three properties make \(\Delta\mathcal{K}\) publishable, and reviewers probe each one explicitly:
- Novelty (\(\Delta\mathcal{K} \neq \varnothing\)): the increment is non-empty. If every claim in the paper already belonged to \(\mathcal{K}_{\text{before}}\), there is no contribution, however well executed the study.
- Validity (\(\Delta\mathcal{K}\) is warranted): the increment is actually licensed by the evidence and argument. Overclaiming—asserting elements of \(\Delta\mathcal{K}\) that the design \(D\) cannot support—is the fastest route to a reviewer’s “the conclusions outrun the data”.
- Importance (\(|\Delta\mathcal{K}|\) matters): the increment is one the field cares about. A true, novel, but trivial claim clears the first two bars and fails the third, and “importance” is precisely the bar that rises from a field journal to the top-4.
Two broad species of contribution recur in marketing, and a paper should know which it is making. A substantive contribution changes what we believe about a marketing phenomenon—that brand prominence signals status through quiet versus loud cues, say, or that responding to online reviews trades complaint quantity for depth (see Chapter 11). A methodological contribution changes how we can learn about phenomena—a new identification strategy, a scalable text measure, a more efficient estimator. The strongest papers often pair a methodological advance with the substantive finding it unlocks, but a paper that is fuzzy about which kind of increment it offers will be read as offering neither.
75.2.2 The contribution statement and the framing trap
A contribution should be expressible as a single declarative sentence of the form “We show that [claim], which prior work did not establish because [reason], using [design].” The clause “which prior work did not establish” is the gap \(G\) of Equation 75.1 made explicit, and it must be true: nothing destroys credibility faster than a literature-savvy reviewer who knows the claimed gap was filled years ago. Conversely, a contribution can be undersold. Authors who have lived inside a problem for years often state their finding in the narrow terms in which they discovered it, missing the more general claim the evidence actually supports. The discipline is to state the most general claim that \(R\) licenses and not one inch more.
Framing is the act of choosing which \(\mathcal{K}_{\text{before}}\) to write against— which conversation the paper joins—and it is a genuine strategic choice, not a neutral description. The same result can be framed as a contribution to several literatures, and the framing determines the reference set, the reviewers, and the perceived importance. A study of how customers respond to a salesperson’s language, for instance, could be framed against the persuasion literature, the frontline-service literature, or the computational-text-analysis literature, and the right choice depends on where the increment \(\Delta\mathcal{K}\) is largest and the audience most receptive. The framing trap is to choose the literature in which the result is most surprising rather than the one in which it is most defensible; surprise attracts an editor’s eye but invites reviewers who hold the strongest priors against the claim.
75.2.3 Setting Up a Question Whose Answer Is Not Already Known
The framing trap above has a constructive counterpart. A paper is read when its question is genuinely open—when a well-informed reader, having finished the introduction, could not confidently guess the result. Most manuscripts fail this test in the first two pages, and the usual reason is that they motivate with a gap rather than a question. “Prior work has not examined \(X\)” tells the reader that something is missing, invites the reply that it may be missing for good reason, and quietly promises that \(X\) will turn out to matter. Everyone knows how that paper ends.
The strongest available move is to assemble two established literatures that imply opposite answers, or that block the two obvious remedies, and then let the data adjudicate. Tanlamai, Khern-am-nuai, and Cohen (2026) is a compact instance, and it is worth reading as a piece of construction rather than for its result (Section 68.10.3.1).
The setup takes two moves. First, decades of evidence establish that houses in white-dominant neighborhoods sell above otherwise-similar houses in minority-dominant neighborhoods, and the literature attributes the gap to human bias. The implied remedy—take the human out of the loop—is the reader’s own next thought, which is exactly why the second move lands: recent work shows the gap is not fixed by conventional AI models, including those designed specifically to address discrimination. Machine bias closes the escape route that human bias opened.
With both remedies blocked, “what does a generative model do here?” becomes a question a reader cannot answer from the armchair. A case runs each way. Generative models are trained on human-produced text and should inherit human bias; they are also statistical predictors and should inherit the proxy encoding that defeats conventional models. Yet they represent a property differently than a hedonic regression over neighborhood features does, and it is not obvious that the same proxies survive that representation. The paper reports that generative AI narrows the gap—and the finding is interesting only because the framing made both directions live beforehand.
Three rules generalize from this.
Both branches must be publishable before you know which one you have. Write the question so that each answer is a contribution, ideally as an explicit pair: if the gap narrows, then \(X\); if it widens, then \(Y\). If only one branch is a paper, the introduction is doing advocacy, and reviewers detect this even when they cannot name it. This is also the honest form of the framing: it is what you would have pre-registered.
A counter-intuitive result raises the evidentiary bar rather than lowering it. Surprise is not a contribution by itself; it is a debt. The reader’s first hypothesis is that something is wrong with the measurement, so a paper of this shape owes a mechanism section, and owes it as a real analysis rather than a paragraph of speculation (Section 43.8, Section 75.6). Papers that lead with a surprising headline and defer the mechanism to “future research” are the ones that fail to replicate.
The two literatures must be summarized in terms their own authors would accept. The move degrades into a straw man the moment either position is flattened to make the opposition sharper. The workable test: write your one-sentence characterization of each literature, and ask whether a proponent would sign it. If either would object, the tension you have constructed is between caricatures, and a referee drawn from that literature will be the one to say so.
75.3 The Descriptive Paper
The template assumed so far—theory, hypotheses, identification, test—is not the only publishable shape, and treating it as such quietly rules out a class of papers the field needs. A descriptive paper establishes what a phenomenon looks like without claiming to have identified a causal effect within it. Its increment \(\Delta\mathcal{K}\) consists of pattern claims: this outcome co-occurs with that antecedent, this population sorts into these categories, this quantity has moved this way over this period.
The genre has explicit methodological warrant. Helfat (2007) argues that stylized facts are a legitimate and necessary input to theory development, because a theory can only be built against a phenomenon whose shape is known. Hambrick (2007) goes further, arguing that the field’s insistence on a theoretical contribution in every paper suppresses precisely the descriptive work theory needs to feed on. Neither position licenses atheoretical data-dumping: Sutton and Staw (1995) is equally clear that data, variables, and diagrams are not themselves theory. The reconciliation is that a descriptive paper contributes a pattern, states it as a pattern, and lets the theoretical payoff be the discipline the pattern imposes on subsequent explanation.
Choudhury, Moeen, and Wormald (2026) supply the positive account. Abduction—the mode of inference that formulates candidate explanations for an unexplained phenomenon—is a distinct research design rather than a deduction that failed to find support. Their treatment distinguishes the abductive trigger (the anomalous observation that starts the inquiry) from creative abduction (generating candidate explanations) and selective abduction (winnowing them), and is explicit that abduction admits no fixed template. That absence of a template is exactly why descriptive papers need to make their design visible on the page: a reader cannot infer it from convention.
75.3.1 What makes a descriptive contribution defensible
Five design choices separate a descriptive paper that publishes from one that reads as a set of cross-tabulations. Table 75.2 states them alongside a worked example: Moeen (2026), which maps founder knowledge origin onto mode of economic value capture in U.S. medical device start-ups and is developed substantively in Chapter 29.
| Design choice | Why it matters | In the worked example |
|---|---|---|
| The outcome is a category, not a magnitude | A mode question (“which market does the venture monetize in?”) has no natural causal counterpart, so description is the right design rather than a consolation prize | Value captured in the market for technology, the market for product, or not at all |
| The antecedent variation is institutionally sharp | A boundary drawn by an institution rather than by the researcher forecloses the “you defined the groups to get the result” objection | Founders who were academic scientists vs. former employees of within-industry firms |
| The typology is declared before the data | A pattern claim can only be wrong—and therefore only be informative—if the correspondence it predicts was specified in advance | Scientific vs. commercial knowledge dimensions, crossed with founder origin |
| The outcome categories are externally classified | Descriptive work dies when the dependent variable rests on the author’s judgment calls | IP transactions and FDA clearance leave a regulatory paper trail |
| The off-diagonal case is reported | The cell that violates the clean mapping is what distinguishes a mechanism from a stereotype; in a design with no treatment, it does the work an interaction term would do elsewhere | Founders bridging both dimensions shift to pioneering products rather than following their institution |
The fifth row deserves emphasis because it is the one most often omitted. A descriptive paper that reports only the clean correspondence has documented a stereotype: academics do this, employees do that. The reader has no way to tell whether the operative variable is the credential or the knowledge. Reporting the cases that break the correspondence, and showing that they break it in the direction the proposed mechanism predicts, converts the pattern into an explanation candidate. This is selective abduction performed in public.
75.3.2 How the contribution sentence changes
The contribution sentence of Section 75.2 still applies, with the causal verb removed and the boundary stated. Rather than “we show that \(X\) causes \(Y\),” a descriptive paper claims “we establish that \(X\) and \(Y\) correspond in population \(P\), which prior work had not documented because it lacked [data/classification/setting], and we show the correspondence tracks \(M\) rather than \(X\) itself.” The final clause is what makes the paper theory-relevant without overclaiming, and it should be paired with an explicit statement of what the design cannot support. Reviewers punish descriptive papers that reach; they reward the ones that name their own ceiling. Stating “we do not claim founder origin is exogenous” in the paper is strictly better than having a reviewer state it for you.
75.3.3 Norms differ by field, and the difference is not subtle
This genre travels much better in Organization Science, Strategic Management Journal, and Strategy Science than in JM, JMR, or Marketing Science, where the descriptive lane is narrower and more codified. In marketing it runs mainly through three channels: empirical generalizations, in which a regularity is established across many datasets and contexts; new-data-source papers, in which the contribution is a measurement capability and the first look it affords; and stylized-facts sections embedded inside otherwise structural or causal papers, where description motivates the model rather than standing alone. Bart J. Bronnenberg, Dhar, and Dubé (2009) is the canonical marketing-side exemplar of the standalone form—a persistent geographic pattern in brand shares, a scaffold for interpreting it, and no causal overclaim.
The practical implication is a targeting decision made before writing. A descriptive paper aimed at a marketing journal usually needs one of the three channels above as its declared home; the same paper aimed at a management journal can stand on the stylized-facts warrant directly. Authors who write the management version and submit it to the marketing journal receive a predictable review: interesting, but what is the identification?
A descriptive paper that stops at the pattern is one genre; a paper that goes on to argue for a particular explanation of that pattern is another, and it needs a reporting structure of its own. That is the subject of Section 75.4.
75.4 The Abductive Paper and the PEEBI Structure
A descriptive paper stops at the pattern. A large class of empirical papers does not: it commits to an explanation of the pattern that was constructed after the pattern was seen, and that was never tested deductively because it did not exist before the data did. This is abduction, or inference to the best explanation (IBE), and it produces a great deal of what marketing knows. The difficulty is not the inference—it is the testimony. Pillai et al. (2026) observe that although scholars employ abduction routinely, there is no agreed-upon structure for reporting it, and the hypo-deductive reporting template does not align with the epistemology of abduction. They propose one, PEEBI, a five-section structure in which the authors take prior knowledge and theories, establish the context and observations worthy of interest, identify and evaluate candidate explanations for the observed patterns, determine the best explanation and their reasoning for accepting it, and abstract that explanation to a more generalizable theoretical contribution. The structure “advances knowledge in a modest, stepwise fashion” and is designed to foreground the author’s judgment rather than hide it.
75.4.1 Why the deductive template misreports abductive work
The template of Section 75.1 asks the reader to grant a chain that begins with a hypothesis and ends with a test. Abductive work runs the other way: the observation comes first, the candidate explanations are generated by the author rather than handed down by prior theory, and the evidence that discriminates among them is assembled afterward. Table 75.3 contrasts what each mode actually asks of a reader.
| Hypo-deductive paper | Abductive paper | |
|---|---|---|
| Where the claim comes from | Derived from theory before the data | Constructed to explain an observation after it |
| What the evidence does | Discriminates \(H\) from \(\neg H\) | Discriminates \(E_k\) from the other candidates in a set the author assembled |
| What the reader grants | That the design could have falsified \(H\) | That the candidate set is adequate and was evaluated evenhandedly |
| What failure looks like | The test does not reject | A rival explanation survives that the author did not consider |
| What must be disclosed | Design, measures, robustness | All of that, plus the order of discovery and the rejected candidates |
| Who does the judging | Nominally the data | Explicitly the author—and, if the paper is written well, the reader |
Forcing abductive work into the deductive template requires a small fiction: the explanation is presented as though it preceded the data. The field already has a name for the vicious version of that fiction—HARKing—and the reason abduction is not HARKing is disclosure: the order of discovery is stated, the rival explanations are named, and the residual uncertainty is quantified or at least bounded. The deductive template deletes precisely those three things. It does not merely misfit the work; it removes the information that licenses the conclusion.
75.4.2 The five acts
Table 75.4 states the five sections, what each one owes the reader, and where it goes in a manuscript aimed at a marketing journal, since few marketing editors will accept section headings named after an epistemology.
| Act | What the section does | What the reader is handed | Marketing manuscript home |
|---|---|---|---|
| Priors | States the prior knowledge and theories the inquiry begins from | The baseline against which the observation is surprising | Introduction and a short theory-background section |
| Establish | Establishes the context and the observations worthy of scholarly interest | The phenomenon itself: measurement, setting, and why the pattern is not an artifact | “Empirical setting” plus a stylized-facts or model-free-evidence section |
| Evaluate | Identifies and evaluates candidate explanations for the observed pattern | The full candidate set and the evidence bearing on each | “Alternative explanations”, promoted from appendix to spine |
| Best | Determines the best explanation and the reasoning for accepting it | The author’s judgment, stated as judgment, with its grounds | “Discriminating evidence” or the analysis section that adjudicates |
| Implication | Abstracts the best explanation into a more generalizable theoretical contribution | The claim that travels beyond this setting, and its boundary | General discussion and theoretical implications |
The move that does the work is the third act. In a conventional marketing paper, alternative explanations are a defensive appendix written to preempt reviewer objections; in an abductive paper they are the argument. A reader who is shown four candidates, the evidence for and against each, and the author’s reasoning for preferring one has been given the material to disagree—which is the point. Pillai et al. (2026) frame this as elevating the reader’s role: the paper’s job is to supply the information a reader needs to reach a judgment, not to foreclose it.
75.4.3 The abductive chain
The counterpart to Equation 75.1 runs
\[ \underbrace{O}_{\text{observation}} \;\Rightarrow\; \underbrace{\mathcal{E} = \{E_1, \dots, E_K\}}_{\text{candidate set}} \;\Rightarrow\; \underbrace{V}_{\text{evaluation}} \;\Rightarrow\; \underbrace{E^{*}}_{\text{best explanation}} \;\Rightarrow\; \underbrace{T}_{\text{abstraction}} \tag{75.3}\]
and, as before, every arrow is a claim the reader may refuse to grant. The observation \(O\) must be real and genuinely surprising against the priors—a pattern that everyone expected is not an abductive trigger. The candidate set \(\mathcal{E}\) must be adequate: it must contain the explanation a hostile expert would propose, which is the arrow that breaks most often. The evaluation \(V\) must apply the same standard to every candidate; searching hard for evidence that supports \(E_1\) and casually for evidence against it is the abductive analogue of a rigged specification search. The selection \(E^{*}\) must dominate the survivors on stated grounds rather than on the author’s enthusiasm. And the abstraction \(T\) must not outrun the case: one setting supports a mechanism claim, not a law.
Failure at each arrow has a diagnostic signature in reviews. A weak \(O\) draws “this is well known.” A thin \(\mathcal{E}\) draws “the authors have not ruled out…” An asymmetric \(V\) draws “the evidence for the preferred story is treated differently from the evidence against it.” An overreaching \(T\) draws “the contribution is not supported by a single context.”
75.4.4 What makes an explanation “best”
The word best carries the whole burden, and Pillai, Goldfarb, and Kirsch (2024) unpack it along two dimensions that do not coincide. An explanation is lovely when it is useful, general, and provides meaning; it is likely when it is close to the truth. Loveliness is what makes a mechanism worth having; likeliness is what makes it true. A managerially elegant story about why a promotion worked can be extremely lovely and quite unlikely, and a precisely estimated coefficient can be likely and entirely unlovely. Their argument is that interpreting observational results requires an understanding of context that statistical analysis alone cannot supply, and that historical methods—hermeneutics, contextualization, and source criticism—help scholars both generate new candidate explanations and judge and balance the virtues that make one explanation better than another.
In marketing the contextual sources are close at hand and systematically underused: category and brand histories, trade press, retailer and manufacturer archives, advertising archives, regulatory filings, and interviews with the people who made the decisions in the data. A researcher who knows that a category was restructured by a distribution change in 1998 has a candidate explanation that no amount of panel-data variance decomposition will hand them.
The practical artifact this yields is a candidate-explanation table, written early and revised as evidence accumulates. Table 75.5 sketches its form for a stylized marketing pattern—a brand’s share is persistently higher in markets it entered first—and it is the single most useful document a student can produce before writing an abductive paper, because it makes the completeness of \(\mathcal{E}\) visible to the author.
| Candidate explanation | Lovely? (useful, general, meaningful) | Likely? (evidence for) | Evidence against | Discriminating test available? |
|---|---|---|---|---|
| Consumer-side brand capital formed early and persisting | High—travels to any repeat-purchase category | Share gap survives entry of national rivals | Cannot separate from supply-side with market-level data alone | Yes: observe consumers who move between markets |
| Supply-side cost or distribution advantage in early markets | Moderate—context-specific | Early entrant has denser distribution | Gap persists after distribution converges | Yes: control distribution and re-measure |
| Retailer assortment and shelf-space lock-in | Moderate | Assortment correlates with share | Pattern holds in categories with weak retailer power | Partly: cross-retailer variation |
| Advertising stock accumulated over decades | High | Cumulative spend correlates with share | Gap holds where historical spend was symmetric | Yes: historical ad-spend series |
75.4.5 A worked example, reconstructed
Marketing has abductive exemplars; what it lacks is the habit of labeling them. Read as a two-paper arc, Bart J. Bronnenberg, Dhar, and Dubé (2009) and B. J. Bronnenberg, Dubé, and Gentzkow (2012) instantiate the chain in Equation 75.3 almost exactly—though neither paper presents itself in these terms, and the reconstruction is ours.
The first paper establishes: brand shares in consumer packaged goods differ persistently across U.S. geographic markets, and the differences track the brand’s early entry more than a century back. Against the priors of a field that models share as a function of current marketing mix, that is a genuine surprise, and the paper states it as a pattern rather than as an effect. The candidate set is the obvious one—something on the demand side (consumers in these markets simply prefer this brand, for reasons formed long ago) versus something on the supply side (the early entrant enjoys durable cost, distribution, or retail advantages there).
Market-level data cannot separate those candidates, and this is where an abductive paper either finds a discriminating observation or admits it cannot. The second paper finds one: consumers who move between markets carry their preferences with them, converging only slowly toward their new market’s shares. Movers separate the two candidates cleanly, because a consumer-side stock travels with the consumer while a supply-side advantage does not. That is act four performed in public—the best explanation determined, with the reasoning for accepting it visible—and the abstraction in act five is the one that made the work matter beyond CPG: brand preference behaves as an accumulated consumer-side capital stock with a very long half-life.
Two features of the arc are worth copying. The discriminating evidence was sought after the candidates were named, not before—the honest order, and the one PEEBI asks you to report. And the abstraction stops where the evidence stops: a claim about how preferences persist and transfer, not a claim that early entry causes share everywhere.
75.4.6 Getting an abductive paper through a marketing review
The genre travels less easily in JM, JMR, and Marketing Science than in SMJ or Organization Science, for the reason given in Section 75.3: the default reviewer question in marketing is “what is the identification?” Three adjustments carry most of the load.
Declare the design in the introduction. A sentence—“we do not test a pre-specified hypothesis; we document a pattern, enumerate the explanations consistent with it, and present evidence that discriminates among them”—costs nothing and prevents the paper from being evaluated against a template it is not using. Reviewers punish papers that appear to have failed at deduction far more than papers that never attempted it.
Keep the conventional headings and put PEEBI underneath them, as in the last column of Table 75.4. The structure is a reporting discipline, not a demand for new section names, and a manuscript that renames its sections after an epistemology spends its first reviewer paragraph defending a formatting choice.
State the ceiling before a reviewer does. The abductive paper’s ceiling is that \(\mathcal{E}\) may be incomplete, and the correct response is to say so and to name what evidence would change the ranking. Papers that specify the observation that would overturn their preferred explanation read as confident; papers that imply the candidate set is exhaustive read as naive. This is the same principle that governs the R&R response in Chapter 76—make the reader’s job of disagreeing with you easy, and they will usually decline the invitation.
Figure 75.2 summarizes the flow, including the loop that the deductive template has no way to represent: evaluation frequently sends the author back for more candidates or more context, and the paper reports the end state of that loop rather than pretending it did not run.
flowchart TD
    P["<b>P</b>riors<br/><i>prior knowledge and theories</i>"] --> E1["<b>E</b>stablish<br/><i>context and observations<br/>worthy of interest</i>"]
    E1 --> E2["<b>E</b>valuate<br/><i>identify and evaluate<br/>candidate explanations</i>"]
    E2 --> B["<b>B</b>est explanation<br/><i>and the reasoning<br/>for accepting it</i>"]
    B --> I["<b>I</b>mplication<br/><i>abstract to a generalizable<br/>theoretical contribution</i>"]
    E2 -.->|"candidate set inadequate"| E1
    B -.->|"no candidate dominates"| E2
    I -.->|"new priors for the next study"| P
    style E2 fill:#e8f0fe,stroke:#1a73e8
    style B fill:#e8f0fe,stroke:#1a73e8
75.4.7 A checklist for the abductive manuscript
A reader finishing each act should be able to answer one question. If they cannot, the act is not written yet.
- After P: what did we believe before, and why is the observation surprising against that belief?
- After E (establish): is the pattern real—measured how, in what population, and robust to what obvious artifacts?
- After E (evaluate): what else could produce this pattern, and what does the evidence say about each of those?
- After B: why this explanation rather than the runner-up, and what would change my mind?
- After I: what claim travels beyond this setting, and where does it stop?
The parallel exercise for a course is worth assigning directly: take a published hypo-deductive paper in the student’s area, reconstruct the abductive history that almost certainly produced it, and rewrite the introduction in PEEBI form. Students discover quickly that the reconstructed version is both more honest and easier to read, which is the argument of Pillai et al. (2026) in miniature. The seminar treatment of abduction as a mode of inference, alongside empirical generalizations and stylized facts, is in Section 64.6.
75.5 The Decomposition Paper
A third genre sits beside description and abduction, and it is the one most likely to rescue a paper whose headline effect is small, imprecise, or already known. Its claim is not “\(X\) affects \(Y\)” but “\(X\) affects \(Y\) through these specific channels, which push in opposite directions, in these proportions, under these conditions.” The increment \(\Delta\mathcal{K}\) is the anatomy of an effect rather than its sign.
The genre is worth naming because the alternative is so common and so weak. A great many papers—in marketing, economics, and management alike—end at a signed average: the promotion raised sales, the technology cut employment, the entry helped the incumbent. Signed averages age badly. They do not transfer to settings where the mixture of channels differs, they cannot explain why two credible studies disagree, and they give a manager or regulator nothing to act on beyond “more” or “less.”
The exemplar. Clemens and Lewis (2026) study a question with a long history of irreconcilable estimates: does employing low-skill immigrants displace native workers? The design is a natural firm-level randomization—the US H-2B visa quota is allocated in part by federal lottery—paired with a pre-analysis plan and a purpose-built firm survey of 2021 lottery winners and losers. That alone would produce a signed average. What makes the paper a template is that the signed average is derived rather than reported.
The authors write down a monopolistically competitive firm producing with immigrant labor \(I\), native low-skill labor \(N\), capital \(K\), and high-skill labor \(H\) in a nested CES technology (Ottaviano and Peri 2012), facing demand elasticity \(\eta\), with immigrant–native substitution elasticity \(\sigma\). Two mechanisms then run in opposite directions. Substitution: immigrants and natives compete for the same tasks, so cheap access to one displaces the other, and the force is governed by \(\sigma\). Scale: relaxing the hiring constraint lets the firm expand output, raising demand for every input including native labor, and the force is governed by \(\eta\). Stripping the model to labor alone makes the arithmetic transparent: with \(s_I\) and \(s_N\) the immigrant and native revenue shares, the effects of winning the lottery on revenue and on native employment are \[ \ln\frac{R_w}{R_\ell} \approx s_I \cdot \frac{\eta - 1}{(\eta-1)(1-s_N) + (\sigma-1)s_N}\cdot \ln\frac{I_w}{I_\ell}, \qquad \ln\frac{N_w}{N_\ell} \approx s_I \cdot \frac{\eta - \sigma}{(\eta-1)(1-s_N) + (\sigma-1)s_N}\cdot \ln\frac{I_w}{I_\ell}. \tag{75.4}\]
The revenue effect is unambiguously non-negative. The employment effect has indeterminate sign, positive when \(\eta > \sigma\) and negative otherwise: whether immigrant hiring crowds natives in or out is not a fact about immigrants but a race between two elasticities. (With capital and high-skill labor restored, the crossing condition generalizes but keeps the same structure.)
Code
# Effects of an exogenous increase in immigrant employment, from eq-sw-decomp.
s_I <- 0.20; s_N <- 0.65          # revenue shares of immigrant and native labor
grid <- expand.grid(eta = c(4, 8, 16), sigma = c(0.5, 1.5, 3, 6))

denom <- with(grid, (eta - 1) * (1 - s_N) + (sigma - 1) * s_N)
grid$revenue_effect  <- with(grid, s_I * (eta - 1)     / denom)
grid$native_effect   <- with(grid, s_I * (eta - sigma) / denom)
grid$verdict <- ifelse(grid$native_effect > 0, "crowds in", "crowds out")

round_df <- within(grid, {
  revenue_effect <- round(revenue_effect, 3)
  native_effect  <- round(native_effect, 3)
})
round_df[order(round_df$eta, round_df$sigma), ]
#>    eta sigma revenue_effect native_effect    verdict
#> 1    4   0.5          0.828         0.966  crowds in
#> 4    4   1.5          0.436         0.364  crowds in
#> 7    4   3.0          0.255         0.085  crowds in
#> 10   4   6.0          0.140        -0.093 crowds out
#> 2    8   0.5          0.659         0.706  crowds in
#> 5    8   1.5          0.505         0.468  crowds in
#> 8    8   3.0          0.373         0.267  crowds in
#> 11   8   6.0          0.246         0.070  crowds in
#> 3   16   0.5          0.609         0.629  crowds in
#> 6   16   1.5          0.538         0.520  crowds in
#> 9   16   3.0          0.458         0.397  crowds in
#> 12  16   6.0          0.353         0.235  crowds in
Every row has a positive revenue effect; the native-employment column flips sign inside the same table. That single display carries more transferable knowledge than any average treatment effect estimated from it, because a reader in a different industry can locate their own \((\eta, \sigma)\) and read off the prediction. The paper’s empirical estimates then close the loop: losing the lottery cuts immigrant employment by 56% and contracts the firm—revenue elasticity about \(+0.16\), investment about \(+1.03\) in the working-paper version, with the published estimates in the range \(0.20\)–\(0.22\) for production and \(1.5\)–\(2.1\) for investment—while the effect on US employment is zero or positive. Read through Equation 75.4, a null employment effect is not a non-result: it identifies the substitution elasticity, which the authors back out at \(0.8\)–\(2.2\), low relative to the demand elasticity, which is exactly why scale wins.
The four moves worth stealing. The genre has a recognizable structure, and each move is portable to a marketing paper.
- Write the model that makes the sign ambiguous. The theory’s job here is not to generate a directional hypothesis but to prove that direction cannot be signed a priori. That reframes a null or mixed result from a failure into an estimate of the parameter that decides the race.
- Turn the mechanism into a prespecified heterogeneity test. The same model predicts where each channel should dominate—larger revenue effects for small firms facing more elastic demand, larger native-employment effects in rural areas where complementary workers have worse outside options—and both predictions were registered in advance and confirmed. Heterogeneity chosen after the fact is fishing; heterogeneity implied by the decomposition is a test.
- Recover the structural parameter from the reduced form. The reduced-form coefficients are used to invert for \(\sigma\), which is the quantity other studies argue about and the quantity that transfers.
- Say which quantity you estimated. The authors distinguish the LATE recovered from the usual shift-share instruments—variation in immigrant supply, irrespective of current demand—from the policy-relevant treatment effect of a policy-induced restriction, and argue their lottery identifies the latter. Naming the estimand is itself a contribution when the literature has been silently averaging over several.
Companion designs. The decomposition move is not foreign to marketing; it is simply underused as an explicit frame.
- Promotion analytics has run on decomposition for decades: a sales spike splits into brand switching, category expansion, purchase acceleration, and stockpiling, and the split—not the spike—determines incremental profit (Van Heerde, Helsen, and Dekimpe 2007; Guyt and Gijsbrechts 2014) (Chapter 20).
- Biswas, Yoganarasimhan, and Zhang (2026) decompose the value of channel adoption by the pathway that produced it, isolating forward buying from habit persistence, and show the two mechanisms imply opposite corrections to incremental CLV (Section 15.8).
- Liu et al. (2026) decompose the environmental effect of platform entry by market structure, finding that the entire average effect comes from dual-platform cities and none from single-platform ones (Section 69.7.1).
- Ellickson, Kar, and Reeder (2023) decompose a campaign’s effect into the effects of its components with double machine learning, turning “the email worked” into which element of the email worked.
- In economics, the same instinct underwrites the task-based decomposition of automation into displacement and reinstatement effects, and the decomposition of trade shocks into substitution and scale channels; the shared feature is that the aggregate is written as a sum of forces with known signs before it is estimated.
A field-experiment specimen. The decomposition frame suits a firm-run randomized experiment especially well, because a policy change seldom moves only one line of the profit statement. Fang et al. (2026) worked with a leading global e-commerce platform to test an agentic-AI refund policy on nearly one million customers. In the treatment arm, an AI system evaluated the customer’s multimodal evidence and offered a partial refund with no return required. The control arm kept the standard process: ship the item back for a full refund. No one could sign the net effect in advance, because the components push in different directions. Refund payouts can rise. Processing costs fall. Less hassle can raise long-run customer value. Strategic claiming is a cost. The paper’s economic framework writes the platform’s payoff in terms of these drivers and states the conditions under which the policy creates value. The experiment then signs each one: payouts rise, processing costs fall, long-term customer value rises, and the net effect on profit is positive. Treated customers go on to buy more, but they also show signs of strategic behavior. The case adds two moves to the four above.
- Name the bundle. The two arms differ in who decides (an AI agent or the standard process), in whether the item comes back, and in how much is refunded. The experiment identifies the effect of that policy as it would be deployed, not the effect of any one component, and the deployment effect is the quantity a platform deciding whether to deploy actually needs (Section 43.3.2). A reader who wants the separate effect of returnlessness needs a different design, and saying so up front pre-empts the referee who would otherwise ask for it.
- Measure the downside. Strategic behavior is the obvious objection to paying refunds without a return. Measuring it and pricing it into the net effect turns the referee’s first question into one of the paper’s findings.
The abstract is also a compact template for the genre. In order, it states the cost the status quo imposes, on consumers in hassle and on firms in money; the technology that makes a new policy feasible; the partner, the randomization, and the scale; the two arms, each described as a complete policy; the framework; the sign of each payoff component; the net effect; the countervailing risk; and the claim to novelty, here “one of the first large-scale causal evaluations” of agentic AI in customer service. The whole promise–payoff loop of Figure 75.1, from problem to redeemed claim, fits in fewer than two hundred words. (Only the abstract was accessible when this section was written; the design details and effect sizes are in the paper.)
Where it fails. Two failure modes recur. The first is decomposition by regression mediation with no design behind it: adding a mediator to a regression and reporting an “indirect effect” decomposes nothing if the mediator is endogenous, and this remains the most common way marketing papers claim mechanism without earning it. The second is decomposing into channels the data cannot separate; if two mechanisms imply identical predictions in every observable dimension, naming them both is rhetoric, not evidence. The test to apply before writing is simple: for each channel in the decomposition, state the observation that would change its estimated share. If no such observation exists, the channel is not identified and the decomposition should be presented as an interpretation rather than a result.
75.6 The Effect–Mechanism–Boundary Paper
A fourth architecture is now common enough in empirical strategy, marketing, and information systems to be worth naming, because students imitate its surface without understanding why it holds together. The paper establishes an effect, then explains it, then bounds it—three stages that answer, in order, whether, how, and for whom. Singh et al. (2026) is a well-built specimen and the running example here; its substance is discussed in Chapter 27.
Stage 1 establishes the effect. Firms adopting open-source product development gained 4–5% in gross margin, estimated with staggered difference-in-differences and replicated under a second DID estimator, generalized synthetic control, an instrumental variable, and two dynamic panel estimators (Chapter 43).
Stage 2 explains it. A moderated mediation model routes the effect through labor productivity and shows the pathway is switched on by external contributor participation (Section 43.8.6).
Stage 3 bounds it. A configurational analysis identifies the resource profiles under which the gains actually appear, finding R&D intensity in every high-profitability configuration (Section 41.2).
75.6.1 Why the stages are ordered, and why the method changes
The ordering is not stylistic. Each stage exists to answer the objection the previous one provokes, which is the same architectural logic as the five-move template in Section 74.3. A reader shown a 4–5% margin gain immediately asks through what, and a reader given a mediation pathway immediately asks for which firms. Reversing the order strands the reader: a mechanism for an effect not yet established is a story about nothing, and a boundary condition on an unexplained effect is a subgroup table.
The subtler point, and the one students miss, is that the method changes at every stage because the question changes. Quasi-experimental estimators answer a counterfactual question about an average. Structural equation modeling answers a question about a pathway’s composition. Set-theoretic analysis answers a question about which combinations of conditions travel with the outcome. Running one technique through all three stages is a category error—a mediation model cannot establish an average effect against selection, and a difference-in-differences cannot represent equifinality. When a manuscript uses the same estimator throughout and merely adds interaction terms, it usually has one stage wearing three hats.
Robustness follows the same principle: put it where the identification is weakest. Their Stage 1 carries six estimators because that is where the causal claim lives. Stage 2 gets a base-versus-full model comparison on AIC and BIC, a 5,000-replication bootstrap, and a second operationalization of the moderator. Stage 3 gets consistency thresholds and a separate analysis of the negated outcome. A uniform robustness appendix applied indiscriminately to all three signals that the author has not thought about which claim is actually fragile.
75.6.2 The honesty requirement
The architecture has a built-in temptation, and resisting it is what separates the good version from the imitation. Identification strength declines across the stages. Stage 1 can be genuinely causal. Stage 2’s mediator-to-outcome link usually is not, because nothing randomized the mediator (Section 43.8.2). Stage 3 is set-theoretic description within a sample. A paper that presents all three in the same confident register is overclaiming, and a careful referee will say so. The fix costs one sentence per stage, stating what the design does and does not support, and it buys the credibility the rest of the paper spends.
Is your Stage 2 load-bearing?
The diagnostic for whether the later stages are contributions or decoration: would a null there have changed the paper? In the running example it would. Without the mediation result, the 4–5% is a fact with no account of itself, equally consistent with cost arbitrage—firms getting free labor—which the authors explicitly rule out by showing that value accrues to firms with R&D rather than to firms with low internal capacity. Without the configurational stage, the paper would recommend open source to everyone, and its actual finding is that it pays only for firms able to absorb what the community sends. If you cannot say what a null at Stage 2 or 3 would have meant, those stages are robustness checks with ambitions, and a referee will read them that way.
When adapting this architecture, the marketing translation is usually straightforward: an adoption or policy shock supplies Stage 1, a mediator the field already measures well—satisfaction, salience, search effort, salesforce productivity—supplies Stage 2, and the firm or customer heterogeneity the field argues about supplies Stage 3. The binding constraint is almost always Stage 2, because the mediator must be measured on the same units and at a frequency that lets it sit causally between the shock and the outcome.
75.6.3 A Second Specimen: When the Effect Is Already in Print
Chan et al. (2026), published online in JMR in 2026, uses the same three-stage architecture under a harder starting condition, and the contrast with the running example is instructive. Its question is whether a public EV charging station on a supermarket’s parking lot raises the store’s revenue; the substance is in Section 53.6.1. The difficulty is that two earlier studies had already reported that nearby chargers raise customer spending at US businesses, by about 5% and 3.2% (Babar and Burtch 2024; Zheng et al. 2024), so the Stage 1 estimate of 3.4% could not by itself be the contribution. This is the situation Section 75.5 describes, a headline effect that is already known, and the paper is worth reading for how its front end converts that effect into a contribution a marketing journal would publish.
The funnel earns the question before it reaches the literature. The introduction opens on the retailer’s opportunity rather than on energy policy: parking lots could become charging hubs that relieve drivers’ “charger anxiety”, and the habitual, high-frequency nature of grocery trips lines up with the recurring need to recharge. A second paragraph shows practice moving, with European grocers and Walmart installing chargers, and a third supplies the tension: penetration is still low, the grid and permitting constraints behind the slow rollout are expected to ease, and no one knows whether demand will materialize or through what mechanisms. The fourth paragraph makes the move that turns this into a marketing paper. It sets aside the rent or revenue share a retailer can earn from the charging operator and declares the grocer’s focal interest to be its core business; the data section later keeps charging income out of the revenue measure, so the dependent variable matches the question. The same paragraph discounts the existing evidence on grounds of credibility rather than absence: industry reports that chargers lift sales lack causal identification, often come from parties with a stake in the answer, and say nothing about mechanisms or boundary conditions. Only then come the three research questions (effect, process, boundary conditions), one paragraph of data and design, and three contributions that mirror the questions one for one. Each contribution closes by naming who can act on it: retailers and policymakers for the effect size, store managers for the process evidence, and managers rolling chargers out across a chain for the heterogeneity. The abstract ends the same way. Figure 75.3 traces the chain.
flowchart LR
  subgraph SG1["Why it matters"]
    direction TB
    M1["Opportunity:<br/>parking lots as<br/>charging hubs"] --> M2["Practice moving,<br/>rollout still slow"]
    M2 --> M3["Retailer's question:<br/>effect on core sales?"]
  end
  subgraph SG2["Why it is still open"]
    direction TB
    G1["Industry claims:<br/>no causal design,<br/>vested interests"] --> G2["Two prior studies:<br/>card data, mixed<br/>US sectors"]
  end
  subgraph SG3["What the paper does"]
    direction TB
    D1["RQ1 effect<br/>RQ2 process<br/>RQ3 boundaries"] --> D2["300+ stores,<br/>staggered DiD"]
  end
  subgraph SG4["Who can act on it"]
    direction TB
    U1["Effect size:<br/>retailers, policymakers"] --> U2["Process:<br/>store managers"]
    U2 --> U3["Boundaries:<br/>chain roll-out managers"]
  end
  SG1 --> SG2
  SG2 --> SG3
  SG3 --> SG4
Positioning against two predecessors is done in a table. The literature section grants the economics, transportation, and operations streams their own questions (subsidies, optimal charger placement, the incentives of businesses to host chargers) and narrows to the one that is open for a retailer: what hosting does to store performance. The two predecessors are credited with showing that a positive effect is possible, and a positioning table then lists study characteristics, process analyses, and heterogeneity analyses as rows, with check marks showing where each earlier study overlaps. That table is \(\mathcal{K}_{\text{before}}\) made explicit, the remedy for the annotated bibliography described in Section 75.7. Each empirical difference is tied to a specific weakness rather than asserted as better data. Cross-sector averages may hide sector heterogeneity, so the paper studies one sector to gain internal validity. Third-party card data omit cash, and cashless payment is known to raise spending, so retailer revenue including cash removes a possible bias. Foot-traffic counts include people who buy nothing, so actual transactions replace them. Chargers anywhere nearby give way to chargers on the retailer’s own premises, which is what a retailer controls. Germany complements the US evidence, and a staggered-robust estimator replaces two-way fixed effects. The substantive gap is then grounded in what the earlier data structurally could not show (a footnote notes they had no within-store variation across categories), and the paper quotes each predecessor’s own call for future research, one for sales measured directly at the retailer and one for the underlying causes of the spending effect, before stating that it answers both.
The identification story is institutional first and tested second. The case for exogenous timing comes from how chargers actually get built. The retailer’s management explains that hardware shortages, grid capacity, and permits from several parties make the go-live date unpredictable by anywhere from a few months to more than a year, and operators racing to sign partnerships are not timing individual stores. The authors then call their own approach conservative and test each way the claim could fail: model-free before-and-after evidence first, then conditional parallel trends, pre-trend leads, selection on observables, late adopters as controls, timing regressed on store traits, a stacked synthetic-control design, alternative catchments and distance thresholds, and named confounds (click and collect, pricing) checked one at a time.
Stage 2 is built by decomposing the outcome, not by adding a mediator. This is the sharpest contrast with the running example and a direct answer to the binding constraint just named. Rather than measure a mediator, the paper splits the outcome along its own identity (revenue is transactions times average basket) and reruns the Stage 1 design on each piece, then on transactions by weekday or weekend and peak or off-peak hour, on promoted versus non-promoted sales, and on dozens of food categories. Two further tests apply the same design to new contrasts: chargers equally close but off the store’s lot, and chargers added by a nearby rival, observed through the chain’s untreated stores. Because each of these tests inherits the Stage 1 identification, most of Stage 2 keeps the causal register that the honesty requirement says mediation usually loses. The exception is the last step, which regresses the category-level effects on category traits such as impulse buying and ability to stockpile; that is association across categories, and it should be read as such. What the decomposition delivers is concrete: more transactions, unchanged basket size, and the largest gains in weekend off-peak hours.
Stage 3 reports the difference test, not just two subgroup estimates. For every median split the paper reports whether the two subgroup effects differ, and several do not (absolute store size, distance to a main road, local charger density), which the text states plainly; the euro translations in the appendix are restricted to splits whose subgroups differ significantly. The register is less even between results and summary. The market-stealing test yields ATT \(= -0.0180\) (\(p = 0.067\)), and the authors note that their data cannot quantify how much of the treated stores’ gain came from rivals; the abstract nonetheless reports “significant evidence for market stealing”, and the discussion says stealing contributes substantially. A reader who checks the summary sentence against the table will notice the difference, and so will a referee. The qualifier the table carries belongs in the sentence that summarizes it.
The “so what” is priced in the reader’s currency. The 3.4% becomes roughly €200,000 a year for an average store. The discussion frames a “triple dividend”: rent from the operator, a higher top line, and demand spread more evenly across the week, which eases staffing. A null result, that a category’s environmental footprint does not predict its uplift, is reported as a finding against an intuitive expectation. The research implications place the paper in three marketing conversations: retail performance, keeping physical stores relevant, and sustainability-oriented marketing. The published version also carries an approved alternative disclosure plan, with proprietary data and disguised data and code deposited with the journal’s Data Editor, which is how a paper built on one retailer’s books meets JMR’s replication policy.
Arguing for an effect someone else found first
- Name the decision maker whose question this is, and choose the outcome that answers that question, even if it means excluding revenue the treatment also produces.
- Treat earlier estimates as a baseline to sharpen. Tie each design difference to a specific bias or blind spot in the earlier measures, never to “better data” in general.
- Ground the gap in what earlier data could not show, and quote the earlier authors’ own calls for future research when they exist.
- Put the positioning in a table a reviewer can audit at a glance.
- Argue exogeneity from the process that sets the treatment date, then test each way that argument could fail.
- If no mediator is measured on the right units at the right frequency, decompose the outcome and rerun the Stage 1 design on each component.
- Report the difference test for every split, and keep the summary sentence in the same register as the table behind it.
- End each contribution with the person who can act on it, and price it in that person’s currency.
75.7 The Front End
The front end—title, abstract, and introduction—is the part of the paper most people read and the only part most people read. It carries the entire promise– payoff loop of Figure 75.1 in compressed form, and a reviewer’s accept-lean or reject-lean is often set before the methods section begins. The front end deserves a disproportionate share of writing effort precisely because it does a disproportionate share of the persuasive work.
75.7.1 The title
A title’s job is to name the contribution in eight to fifteen words such that the right reader stops scrolling. It should contain the paper’s key constructs (the terms a searcher would type) and, where possible, signal the relationship the paper establishes rather than merely the topic it addresses. “Brand Prominence and Status Signaling” names a topic; “Signaling Status with Luxury Goods: The Role of Brand Prominence” names a relationship and a mechanism. Question titles and two-part titles (a hook before the colon, the substance after) are common in JCR and JM and rarer in Marketing Science, reflecting the venues’ different house voices—a difference worth matching to the target journal.
75.7.2 The abstract
The abstract is the most-read and least-revised 250 words in science, and the imbalance is a mistake. It must be self-contained: a reader who sees only the abstract should be able to state the paper’s objective, method, principal finding, and implication. The canonical structure mirrors Equation 75.1 in miniature—one or two sentences each for the problem, the approach, the result (with direction and, where it fits, magnitude), and the “so what”. Two failure modes dominate. The descriptive abstract announces what the paper does (“we examine the effect of X on Y”) without ever stating what it found, leaving the reader no wiser; the overloaded abstract crams in every robustness check and moderator, drowning the headline. The fix for both is the same: lead with the finding.
75.7.3 The introduction as a funnel
The introduction is where most rejections are decided, and it has a near-mechanical structure: a funnel from the broad problem to the specific contribution. A robust template runs problem \(\rightarrow\) tension or puzzle \(\rightarrow\) gap \(\rightarrow\) “in this paper we” \(\rightarrow\) approach \(\rightarrow\) findings \(\rightarrow\) contributions \(\rightarrow\) roadmap. Figure 75.4 renders it.
flowchart TD
    P["The broad problem<br/><i>why anyone should care</i>"] --> T["The tension / puzzle<br/><i>what doesn't fit</i>"]
    T --> G["The gap<br/><i>what prior work left open</i>"]
    G --> Q["<b>In this paper, we…</b><br/><i>the pivot to contribution</i>"]
    Q --> A2["Approach<br/><i>data and method, one paragraph</i>"]
    A2 --> F["Findings<br/><i>headline results, with direction</i>"]
    F --> C2["Contributions<br/><i>ΔK, stated as claims</i>"]
    C2 --> R2["Roadmap<br/><i>optional, brief</i>"]
    style Q fill:#fce8e6,stroke:#d93025
    style C2 fill:#e6f4ea,stroke:#188038
Two discipline points govern the funnel. First, the pivot sentence—“In this paper, we…”—should arrive early, by the end of the second page; an introduction that is still motivating the problem on page four has lost the reviewer. Second, the contributions should be stated as claims the reader will be able to accept, not as activities the authors performed. “We contribute by examining the role of arousal” is an activity; “We show that empathetic responses raise gratitude even before a service failure is resolved, which the prior literature’s resolution-centric models cannot accommodate” is a claim and an explicit \(\Delta\mathcal{K}\).
75.7.4 Positioning against the literature
The literature review is not a homage to everyone who has touched the topic; it is the construction of \(\mathcal{K}_{\text{before}}\), the precise baseline against which the contribution is measured. Its house failure mode is the annotated bibliography—a serial list of “Author (year) found X; Author (year) found Y”—which demonstrates reading but not synthesis and leaves the reviewer to infer the gap. The remedy is to organize the review around tensions and open questions rather than around papers, so that the gap emerges as the natural next move in a conversation the reader can now follow. The house style guide’s instruction to weave, not list citations is exactly this principle applied at the sentence level: each citation should earn its place by advancing the argument, and the strongest evidence per point should crowd out the duplicative.
75.8 Writing for the Top-4
75.8.1 What rises to a top journal
The top-4 differ from solid field journals less in the correctness of the work they publish than in the size and generality of the increment \(\Delta\mathcal{K}\). The bar that rises is importance: a top-4 paper must change how a non-trivial slice of the field thinks, not merely add a brick to a narrow wall. Editors and reviewers operationalize this in recurring questions—Would I assign this in a doctoral seminar? Does it change what I would tell a manager? Does it open new research, or close a question others were pursuing? A paper can be flawless and still be rejected for answering a question too few people were asking.
The venues also have distinguishable identities, and matching the paper to the venue is part of the craft. Marketing Science and JMR lean toward methodological rigor and formal models—a structural estimator or an analytical game-theoretic result is at home there. JCR prizes psychological process and theory, typically established across multiple experiments that triangulate a mechanism. JM spans substantive and managerial questions with an explicit demand for managerial relevance. The same finding, dressed for the wrong venue, draws reviewers who want what the paper was never built to deliver.
75.8.2 Genres of contribution: many roads to the top-4
The importance bar is not cleared in a single way. Marketing is methodologically plural, and a top journal publishes several distinct genres of research, each with its own logic of contribution and its own standard of proof. Naming the genre—to oneself first, then to the reader—matters as much as naming the paper type earlier in this chapter, because a reviewer recruited for one genre will judge by its rules. A working map of the traditions a marketing scholar will meet:
- Experimental and consumer-behavior work identifies a psychological mechanism by controlled manipulation, usually triangulated across several studies that close off rival accounts one at a time. The contribution is a process: not merely that \(X\) moves \(Y\) but why.
- Analytical / game-theoretic work builds a deliberately stylized model and extracts a non-obvious, general implication from its equilibrium—why a firm might rationally do the counterintuitive thing. The currency is generality, not data.
- Empirical / structural work estimates the primitives of behavior—preferences, costs—under an explicit identification argument so it can run counterfactuals the raw data never ran (Section 37.4). The contribution is policy-relevant quantities and the “what if” they license.
- Descriptive work documents robust, previously unseen patterns in novel—often large-scale—data, and makes no causal claim. The contribution is the fact itself.
- Prescriptive / optimization work formulates a decision problem and solves it with a guarantee or a demonstrably better method (Section 37.4.1). The contribution is a solvable formulation and its performance.
- Strategy and marketing-management work links a marketing action to firm outcomes and firm value with an explicit demand for managerial relevance (the JM register above).
These are axes, not bins: a single paper is often empirical and descriptive, or analytical and prescriptive, and the strongest work borrows across them. But the reader must be told which claim bears the weight, because the standard of proof differs by genre—an identification argument is decisive for a structural paper and beside the point for an analytical one.
The genre students most often underrate is the descriptive, and it repays a closer look because its revival is one of the field’s live developments. For two decades the credibility revolution (Section 76.8) so prized causal identification that pure description read as second class—a table on the way to a regression. That has reversed, for a concrete reason: platform, transaction, and sensor data now expose patterns no prior dataset could show, and a pattern no one had seen is a genuine increment to \(\mathcal{K}\) even with no causal arrow attached. The descriptive paper still clears the top-4 bar, but on different terms. It does not owe internal validity for an effect it never claims; it owes (i) genuinely novel data, (ii) patterns robust to how the data are sliced, (iii) a surprise—a fact that overturns or sharpens a belief the field held—and (iv) scrupulous candor about what is described versus explained. Overclaiming causation is the descriptive paper’s characteristic failure; under-selling importance (“we merely describe”) is its mirror-image one.
Chen and Xiang (2026) is a clean specimen. From millions of cross-border orders the authors document a U-shaped relationship between income and counterfeit consumption—both low- and high-income consumers buy more fakes than the middle, with the tails differing in composition—advancing no instrument and estimating no treatment effect. Its title announces “A Descriptive Analysis,” and its contribution is precisely the documented gradient, which complicates the tidy poseur account of counterfeit demand (Chapter 11). That the top journals now run short-format Frontiers articles for exactly this kind of high-value description—Kaiser and Schulze (2026)’s map of a nascent LLM sales channel is a companion case—is institutional evidence that the genre has a settled place. The craft lesson mirrors the framing discipline of Section 75.2: know your genre, promise the kind of contribution it actually makes, and defend it on its own terms rather than borrowing the rhetoric of a genre you did not practice.
75.8.3 Robustness as rhetoric
At the top-4, a single clean result rarely suffices; the paper must anticipate and preempt the reviewer’s alternative explanations. This is why top-4 empirical papers carry batteries of robustness checks, alternative specifications, and—in experimental work—multiple studies whose designs rule out competing accounts one by one. The logic is the broken-arrow logic of Equation 75.1: every alternative explanation is a way the arrow \(D \Rightarrow R\) might fail, and each robustness check is a patch that keeps the arrow intact. The writing task is to present this defensive machinery without burying the headline—typically by stating the main result cleanly, then organizing the defenses as a navigable sequence of named threats and the evidence that disarms each.
The reviewer is not your enemy; the reviewer is the proxy for every skeptical reader your paper will ever have. Every alternative explanation a reviewer raises is one a future reader would have raised silently and then disbelieved you. Writing the rebuttal into the paper before submission is simply doing the reviewer’s job for them, and it is the single highest-return revision activity.
75.8.4 The review process and the response
Top-4 papers are essentially never accepted on first submission; the modal good outcome is a revise and resubmit (R&R), and the revision is where many papers are won or lost. The response to reviewers is itself a document with its own craft. Its governing principle is that the author’s job is to make the editor’s accept-decision easy to defend: every reviewer comment receives a numbered, verbatim restatement followed by a specific response and a pointer to the exact change in the manuscript. Disagreement is permitted but must be argued with evidence, courteously, and sparingly—an author who fights every point signals defensiveness, while an author who concedes everything signals that the original work was unconsidered. The art is to distinguish comments that improve the paper (adopt them) from comments that reflect a misunderstanding (clarify the text so the next reader does not misunderstand either) from the rare comment that is simply wrong (rebut it with evidence and grace).
75.9 Clarity and Revision
75.9.1 Clarity as a property of the reader, not the writer
Clarity is not an ornament; it is the probability that a reader recovers the intended meaning on the first pass. Writing that the author finds clear because the author already knows the answer is a category error—the test of clarity is whether a reader who does not yet know the conclusion can follow the argument. A few sentence-level disciplines do most of the work, and they are mechanical enough to apply as a checklist. Prefer the active voice and a concrete agent (“we estimate”, “the model predicts”) over agentless passives that hide who did what. Put the subject and verb early and close together so the reader is not made to hold an open clause across half a line. Use one term for one concept—do not alternate “effect”, “impact”, and “influence” for the same quantity, because the reader will hunt for a distinction that is not there. Expand every acronym on first use and define every construct before deploying it, a discipline the house style enforces throughout.
75.9.2 Measuring readability
Readability can be measured, and while no formula substitutes for judgment, the indices make a useful diagnostic. The Gunning fog index estimates the years of formal education a reader needs to understand a passage on first reading (Gunning et al. 1952). Let a passage contain \(W\) words, \(S\) sentences, and \(C\) “complex” words (three or more syllables, excluding common suffix inflections). The index is
\[ \text{Fog} \;=\; 0.4\left(\frac{W}{S} \;+\; 100\,\frac{C}{W}\right), \tag{75.5}\]
a weighted sum of average sentence length and the percentage of complex words. The two terms encode the two main sources of difficulty—long sentences and unfamiliar words—and the constant scales the result to a U.S. grade level, so a fog score of 12 corresponds roughly to the reading level of a high-school senior. Academic prose runs higher, but a methods section with a fog score in the high teens is usually not “rigorous”; it is merely overlong in the sentence and overloaded in the noun phrase. Textual-complexity measures of exactly this family are now standard tools in the marketing and finance literatures for analyzing corporate disclosures and other documents at scale (Loughran and McDonald 2024, 2020), which is a useful reminder that the readability of your prose is itself a measurable, and therefore improvable, quantity.
The estimator in Equation 75.5 is a heuristic, not a model, and its assumptions are worth stating because they tell you when it misleads. It assumes that syllable count proxies word difficulty (false for short technical jargon like “prior” or “yield”, which are hard despite being monosyllabic) and that sentence length proxies syntactic load (false for a long but perfectly parallel list). It is best read as a smoke detector: a high score reliably indicates a problem somewhere, but a low score does not certify clarity. The following chunk implements it and a companion length diagnostic so the measure is reproducible rather than mystical; Figure 75.5 shows the score falling as the same sentence is progressively tightened.
Code
set.seed(41)

# A deliberately rough syllable counter: count vowel groups per word.
# Heuristic, not linguistic ground truth -- adequate for a relative diagnostic.
count_syllables <- function(word) {
  word <- tolower(gsub("[^a-z]", "", word))
  if (nchar(word) == 0) return(0L)
  groups <- gregexpr("[aeiouy]+", word)[[1]]
  n <- if (groups[1] == -1L) 1L else length(groups)
  if (grepl("e$", word) && n > 1L) n <- n - 1L   # silent terminal 'e'
  max(n, 1L)
}

gunning_fog <- function(text) {
  sentences <- unlist(strsplit(text, "(?<=[.!?])\\s+", perl = TRUE))
  sentences <- sentences[nzchar(trimws(sentences))]
  words <- unlist(strsplit(text, "\\s+"))
  words <- words[nzchar(words)]
  W <- length(words); S <- max(length(sentences), 1L)
  syl <- vapply(words, count_syllables, integer(1))
  C <- sum(syl >= 3L)                              # "complex" words
  0.4 * (W / S + 100 * C / W)
}

versions <- c(
  bloated  = paste("The utilization of an excessively elaborate and",
                   "circumlocutory prose style, characterized by the",
                   "accumulation of subordinate clauses, demonstrably",
                   "attenuates comprehensibility for the readership."),
  moderate = paste("Using an elaborate, indirect prose style with many",
                   "subordinate clauses reduces how well readers understand",
                   "the argument."),
  lean     = "Dense prose is hard to read."
)

fog <- vapply(versions, gunning_fog, numeric(1))
print(round(fog, 1))
#>  bloated moderate     lean
#>     28.3     20.9      2.4

barplot(fog, col = "grey80", border = NA, ylab = "Gunning fog (grade level)",
        main = "Readability across three drafts of one claim",
        names.arg = names(versions))
abline(h = 12, lty = 2)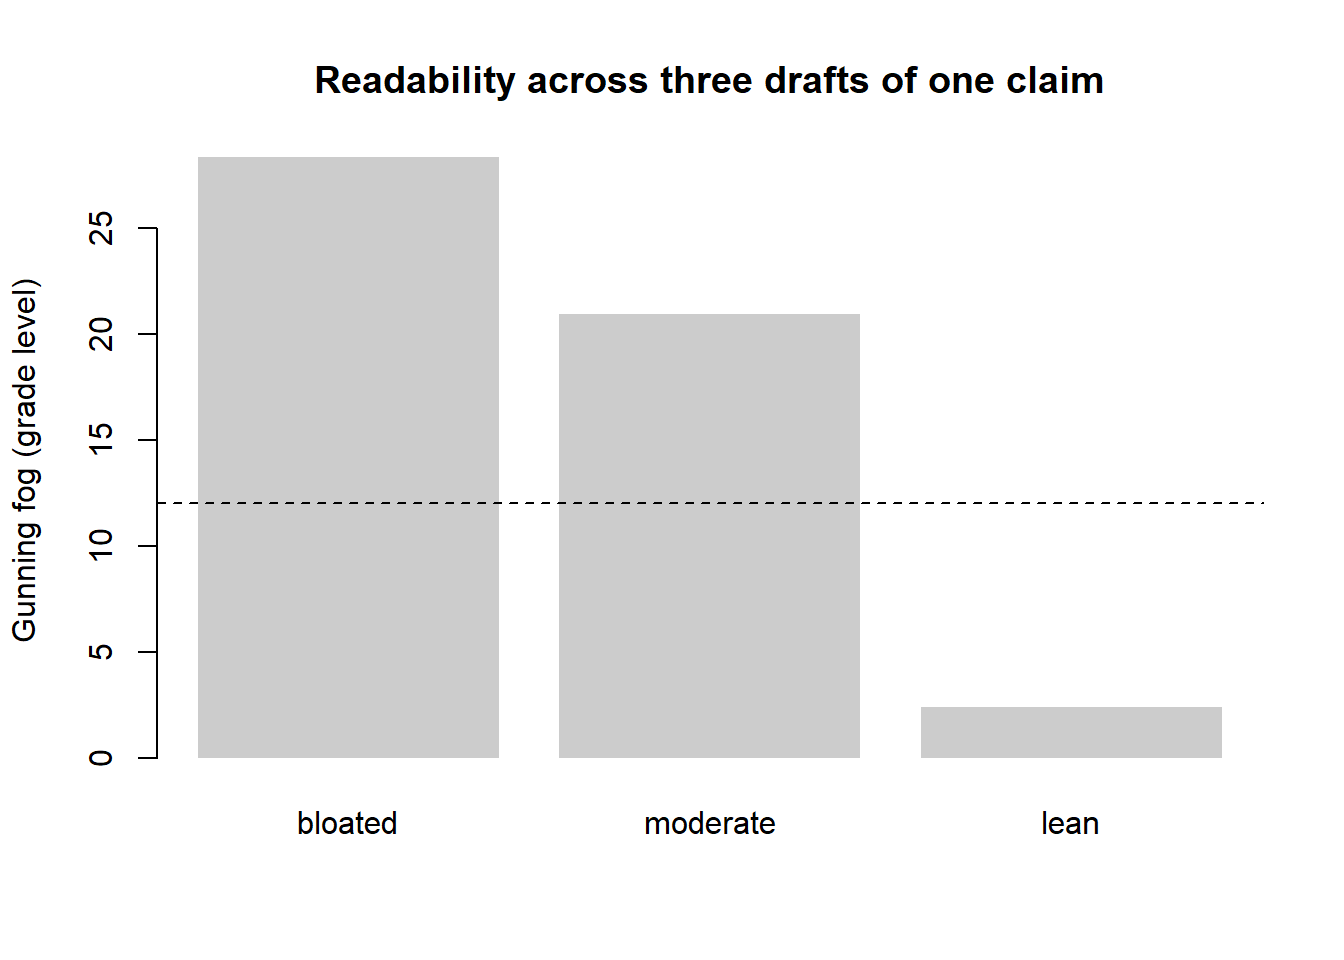
75.9.3 Revision as a process
First drafts are for the writer; revision is for the reader. The empirical regularity behind all writing advice is that meaning is discovered, not transcribed: the act of writing reveals which arrows in Equation 75.1 are actually weak, and the first draft’s value is largely diagnostic. Productive revision proceeds top-down— structure before paragraph, paragraph before sentence, sentence before word—because fixing a comma in a paragraph that will be deleted is wasted effort. A useful sequence is to first verify that the contribution sentence is present and true, then that each section answers its one question, then that each paragraph has a single point announced in its first sentence, and only then to polish prose. The “reverse outline”—reading the draft and writing in the margin the single claim each paragraph makes—exposes structural defects (two paragraphs making the same point, a claim with no supporting paragraph, a paragraph with no claim) that are invisible at the sentence level.
A final discipline is distance. Prose that seems clear the night it is written is frequently opaque a week later, when the author has forgotten the unstated assumptions that made it cohere—and a week-later author is a closer proxy for the real reader than the night-of author ever is. Where time does not permit distance, a co-author or colleague reading cold is the next best instrument, and the most valuable feedback is not “I disagree” but “I got lost here”, because confusion localizes a broken arrow that the author can no longer see.
75.10 Key Takeaways
- A paper is a reconstructed argument, not a lab diary: the order of exposition is engineered for the reader, and each section answers exactly one question with its own default verb tense (Table 75.1).
- The effect–mechanism–boundary architecture answers whether, how, and for whom in that order, and the method must change at each stage because the question does—quasi-experimental for the average effect, structural equations for the pathway, set-theoretic for the configurations (Section 75.6). Put the robustness where identification is weakest, and state plainly that identification strength declines from stage to stage. The test of whether the later stages are contributions rather than decoration is whether a null there would have changed the paper (Singh et al. 2026).
- The argument is a chain of claims the reader may refuse to grant (Equation 75.1); a paper fails at its weakest arrow, and most “low contribution” rejections are in fact broken arrows—a filled gap or a design that cannot license the conclusion.
- Motivate with a question, not a gap. The strongest setup assembles two established literatures that imply opposite answers, or that block both obvious remedies, so that no informed reader can guess the result—human bias and machine bias doing exactly that in Tanlamai, Khern-am-nuai, and Cohen (2026) (Section 75.2.3). Write it so both branches are publishable before you know which one you have; remember that a counter-intuitive finding raises the evidentiary bar and obligates a real mechanism section; and state each literature’s position in terms its own authors would sign.
- A contribution is the warranted increment to knowledge \(\Delta\mathcal{K}\) (Equation 75.2); it must be novel, valid, and important, and the top-4 bar that rises is importance. State the most general claim the evidence licenses, and not one inch more.
- The front end carries the promise; the discussion must redeem exactly that promise. Make the “in this paper, we…” pivot early and state contributions as claims, not activities (Figure 75.4).
- Not every paper is hypo-deductive. A descriptive paper contributes a pattern and names its ceiling; an abductive paper reasons from the pattern to the best explanation and owes the reader the whole candidate set (Equation 75.3). The PEEBI structure—priors, establish, evaluate, best explanation, implication (Table 75.4)—reports that reasoning honestly where the deductive template would force a fiction about the order of discovery.
- Robustness is rhetoric: writing the reviewer’s objections into the paper before submission is the highest-return revision activity, and the R&R response is a craft document whose job is to make the editor’s decision easy to defend.
- Clarity is a property of the reader: measure it (Equation 75.5), revise top-down from structure to sentence, and use distance or a cold reader to localize the arrows you can no longer see are broken.
75.11 Further Reading
For the structure of scientific argument and the discipline of revision, the classic writing-craft literature is the natural starting point; for the specific norms of the marketing top-4, the editorials and “from the editor” notes of JM, JMR, Marketing Science, and JCR are the authoritative—and frequently updated— statements of what each venue rewards. The On the reporting of non-deductive work, Pillai et al. (2026) is the direct statement of the PEEBI structure and Pillai, Goldfarb, and Kirsch (2024) the companion treatment of what makes one explanation better than another; Choudhury, Moeen, and Wormald (2026) supplies the design-side account of abduction that the two SMJ papers presuppose. Read together they are the closest thing the field has to a manual for writing a paper whose conclusion was discovered rather than predicted.
The textual-analysis methods that let us measure the readability of our own and others’ prose are developed in the disclosure literature (Loughran and McDonald 2024, 2020) and connect this chapter to the broader treatment of text as data elsewhere in the book.
Babar, Yash, and Gordon Burtch. 2024. “Recharging Retail: Estimating Consumer Demand Spillovers from Electric Vehicle Charging Stations.” Manufacturing & Service Operations Management 26 (3): 797–813. https://doi.org/10.1287/msom.2022.0519.
Biswas, Shirsho, Hema Yoganarasimhan, and Haonan Zhang. 2026. “Channel Adoption Pathways and Post-Adoption Behavior.” Journal of Marketing. https://doi.org/10.1177/00222429261478875.
Bronnenberg, Bart J., Sanjay K. Dhar, and Jean-Pierre H. Dubé. 2009. “Brand History, Geography, and the Persistence of Brand Shares.” Journal of Political Economy 117 (1): 87–115. https://doi.org/10.1086/597301.
Bronnenberg, Bart J., Jean-Pierre H. Dubé, and Matthew Gentzkow. 2012. “The Evolution of Brand Preferences: Evidence from Consumer Migration.” American Economic Review 102 (6): 2472–2508. https://doi.org/10.1257/aer.102.6.2472.
Chan, Ka Wing, Hauke A. Wetzel, Ljubomir Pupovac, Marnik G. Dekimpe, and Dominic Loske. 2026. “EV Charging Availability and Grocery Store Performance.” Journal of Marketing Research. https://doi.org/10.1177/00222437261491290.
Chen, Nan, and Mengqi Xiang. 2026. “Frontiers: The Demand for Counterfeits: A Descriptive Analysis.” Marketing Science 45 (4): 716–27. https://doi.org/10.1287/mksc.2025.0565.
Choudhury, Prithwiraj, Mahka Moeen, and Audra Wormald. 2026. “Cultivating and Embracing Plurality in Abductive Inquiries Within Strategy Research.” Strategic Management Journal. https://doi.org/10.1002/smj.70120.
Clemens, Michael A., and Ethan G. Lewis. 2026. “The Effect of Low-Skill Immigration Restrictions on US Firms and Workers: Evidence from a Randomized Lottery.” American Economic Journal: Applied Economics 18 (3): 43–82. https://doi.org/10.1257/app.20250049.
Ellickson, Paul B., Wreetabrata Kar, and James C. Reeder. 2023. “Estimating Marketing Component Effects: Double Machine Learning from Targeted Digital Promotions.” Marketing Science 42 (4): 704–28. https://doi.org/10.1287/mksc.2022.1401.
Fang, Lu, Chunhua Wu, Zhe Yuan, and Kaifu Zhang. 2026. “Returnless Partial Refunds: A Large-Scale Field Experiment in E-Commerce.” Marketing Science. https://doi.org/10.1287/mksc.2025.0618.
Gunning, Robert et al. 1952. “Technique of Clear Writing.”
Guyt, Jonne Y., and Els Gijsbrechts. 2014. “Take Turns or March in Sync? The Impact of the National Brand Promotion Calendar on Manufacturer and Retailer Performance.” Journal of Marketing Research 51 (6): 753–72. https://doi.org/10.1509/jmr.14.0193.
Hambrick, Donald C. 2007. “The Field of Management’s Devotion to Theory: Too Much of a Good Thing?” Academy of Management Journal 50 (6): 1346–52. https://doi.org/10.5465/amj.2007.28166119.
Helfat, Constance E. 2007. “Stylized Facts, Empirical Research and Theory Development in Management.” Strategic Organization 5 (2): 185–92. https://doi.org/10.1177/1476127007077559.
Kaiser, Maximilian, and Christian Schulze. 2026. “Frontiers: ChatGPT Referrals to e-Commerce Websites: How Do LLMs Compare Against Traditional Channels?” Marketing Science 45 (4): 699–715. https://doi.org/10.1287/mksc.2025.0489.
Liu, Qianqian, Shenyang Jiang, Liangfei Qiu, and Baofeng Huo. 2026. “Platform Competition and Adoption Heterogeneity: How Dockless Bike Sharing Shapes Urban Air Quality.” Production and Operations Management. https://doi.org/10.1177/10591478261472202.
Loughran, Tim, and Bill McDonald. 2020. “Textual Analysis in Finance.” Annual Review of Financial Economics 12 (1): 357–75. https://doi.org/10.1146/annurev-financial-012820-032249.
———. 2024. “Measuring Firm Complexity.” Journal of Financial and Quantitative Analysis 59 (6): 2487–2514. https://doi.org/10.1017/S0022109023000716.
Moeen, Mahka. 2026. “From Founders’ Knowledge to Economic Value Capture in Academic and Employee Start-Ups.” Organization Science. https://doi.org/10.1287/orsc.2023.18121.
Ottaviano, Gianmarco I. P., and Giovanni Peri. 2012. “Rethinking the Effect of Immigration on Wages.” Journal of the European Economic Association 10 (1): 152–97. https://doi.org/10.1111/j.1542-4774.2011.01052.x.
Pillai, Sandeep Devanatha, Brent Goldfarb, and David Kirsch. 2024. “Lovely and Likely: Using Historical Methods to Improve Inference to the Best Explanation in Strategy.” Strategic Management Journal 45 (8): 1539–66. https://doi.org/10.1002/smj.3593.
Pillai, Sandeep Devanatha, Brent Goldfarb, David A. Kirsch, Seojin Kim, and Evan Starr. 2026. “From Hypothesis Testing Toward Inference to the Best Explanation: A PEEBI Testimonial Structure for Abductive Studies in Strategy.” Strategic Management Journal. https://doi.org/10.1002/smj.70114.
Singh, Shivendu Pratap, Narayan Ramasubbu, Chris F. Kemerer, and Muhammad Zia Hydari. 2026. “Profitability of Open-Source Software Product Development.” Information Systems Research. https://doi.org/10.1287/isre.2025.1821.
Sutton, Robert I., and Barry M. Staw. 1995. “What Theory Is Not.” Administrative Science Quarterly 40 (3): 371–84. https://doi.org/10.2307/2393788.
Tanlamai, Jitsama, Warut Khern-am-nuai, and Maxime C. Cohen. 2026. “Generative AI and Price Discrimination in the Housing Market.” Information Systems Research. https://doi.org/10.1287/isre.2024.1234.
Van Heerde, Harald, Kristiaan Helsen, and Marnik G. Dekimpe. 2007. “The Impact of a Product-Harm Crisis on Marketing Effectiveness.” Marketing Science 26 (2): 230–45. https://doi.org/10.1287/mksc.1060.0227.
Zheng, Yunhan, David R. Keith, Shenhao Wang, Mi Diao, and Jinhua Zhao. 2024. “Effects of Electric Vehicle Charging Stations on the Economic Vitality of Local Businesses.” Nature Communications 15 (1): 7437. https://doi.org/10.1038/s41467-024-51554-9.