The constructs so far have described the consumer as an evaluator (Chapter 6), a relationship partner (Chapter 5), and a brand-identifier (Chapter 7). This chapter turns to the consumer as a participant—someone whose contribution to a firm extends past the purchase to include attention, effort, advocacy, content, and referrals. Three constructs organize this participatory turn. Involvement is the motivational state—the personal relevance of an object that determines how much cognitive effort a consumer will expend on it. Engagement is the set of behavioral and psychological manifestations of an active relationship that go beyond transactions. And word of mouth (WOM) is the social output—the informal communication about products and brands that consumers direct at other consumers, and that has become, in the digital era, the most consequential and most measurable of the three.
These constructs have moved from the periphery of marketing to its center as firms have recognized that a customer’s value is not exhausted by what they buy: a customer who writes reviews, refers friends, and defends the brand creates value through channels that transaction data alone cannot see. We develop involvement first, as the motivational antecedent and a moderator that reshapes how all persuasion works; then customer engagement, including its decomposition into a total engagement value; then word of mouth as a construct distinct from the mechanics of diffusion treated in Chapter 27. As throughout this part, the measurement subtext is discriminant validity: engagement, involvement, participation, and WOM-intention are easy to define apart and hard to keep apart in data.
8.1 Involvement
Involvement is a person’s perceived relevance of an object based on inherent needs, values, and interests (Zaichkowsky 1985). It is a motivational construct: high involvement means the object matters to the consumer, which mobilizes attention, information search, and elaboration; low involvement means it does not, so decisions are made with minimal cognitive effort. Zaichkowsky (1985) develops the Personal Involvement Inventory to measure it reflectively, and the construct is standardly partitioned along two axes—enduring involvement (a stable interest in a category) versus situational involvement (temporarily heightened by a purchase occasion or risk), and by object (product, advertising, and purchase-decision involvement).
Involvement’s theoretical importance is less as an outcome than as a moderator of how persuasion operates. The Elaboration Likelihood Model (Petty, Cacioppo, and Schumann 1983) holds that persuasion travels two routes: a central route, in which highly involved consumers scrutinize the quality of an argument, and a peripheral route, in which uninvolved consumers respond to surface cues (source attractiveness, number of arguments, music) without evaluating substance. Involvement determines which route dominates, so the same advertisement persuades through different mechanisms depending on the audience’s involvement—a result that reshapes advertising strategy (Chapter 13) and that makes involvement a prerequisite variable for almost any study of message effects.
8.1.1 Involvement as a moderator of message effects
The ELM’s central prediction is an interaction: argument quality matters more for high-involvement consumers, while peripheral cues matter more for low-involvement consumers. The chunk simulates this crossover and recovers the two interactions, illustrating why a study that ignores involvement will estimate an average message effect that describes no actual consumer.
Code
set.seed(1983)n<-4000involvement<-rbinom(n, 1, 0.5)# 1 = high, 0 = lowarg_quality<-rnorm(n)# strength of the message's argumentsperiph_cue<-rnorm(n)# attractiveness/number of cues# High-involvement: persuasion via argument quality (central route).# Low-involvement: persuasion via peripheral cues.attitude<-0.10+0.55*involvement*arg_quality+# central route (only when involved)0.10*(1-involvement)*arg_quality+0.50*(1-involvement)*periph_cue+# peripheral route (only when uninvolved)0.10*involvement*periph_cue+rnorm(n, sd =0.8)fit<-lm(attitude~arg_quality*involvement+periph_cue*involvement)co<-round(summary(fit)$coefficients[, c("Estimate", "Pr(>|t|)")], 3)# Show the main effects and their involvement interactions (robust to term naming).keep<-grepl("arg_quality|periph_cue", rownames(co))print(co[keep, ])#> Estimate Pr(>|t|)#> arg_quality 0.079 0#> periph_cue 0.511 0#> arg_quality:involvement 0.492 0#> involvement:periph_cue -0.404 0
The positive arg_quality:involvement interaction and the negative periph_cue:involvement interaction are the ELM crossover: involvement routes persuasion. An analyst who omitted involvement and regressed attitude on argument quality alone would recover a muddy average, understating the central route for the involved and missing the peripheral route for the uninvolved entirely.
8.2 Customer Engagement
Customer engagement generalizes the relationship beyond the transaction. Doorn et al. (2010) define customer engagement behaviors (CEBs) as a customer’s behavioral manifestations toward a firm, beyond purchase, that result from motivational drivers—writing reviews, making recommendations, helping other customers, blogging, and otherwise contributing. Brodie et al. (2011) give the construct its conceptual domain, framing engagement as an interactive, co-creative experience with a focal object that comprises cognitive, emotional, and behavioral dimensions and that arises within an iterative process of relationship development. Hollebeek (2011) develops the brand-specific version. The common thread is that engagement captures value-creating customer activity that purchase metrics miss, which is why it rose to prominence exactly as social media made such activity visible and abundant.
Pansari and Kumar (2017) supply the nomological network: engagement is built on a foundation of satisfaction and emotion (a relationship must be both satisfying and emotionally connected to become engaged), and it produces value through direct contributions (purchases) and indirect contributions (referrals, influence, feedback). The direct/indirect split is the conceptual bridge to a measurement program that tries to put a number on the whole of a customer’s value.
8.2.1 Total customer engagement value
Kumar et al. (2010) decompose a customer’s total worth into four additive components—the move that lets engagement be valued, not just described:
Customer Lifetime Value (CLV): the discounted margin from the customer’s own purchases (the construct developed in Chapter 15).
Customer Referral Value (CRV): value from customers acquired through this customer’s formal referrals.
Customer Influencer Value (CIV): value from this customer’s influence on other customers and prospects through word of mouth and social spread.
Customer Knowledge Value (CKV): value from the feedback and ideas the customer contributes to the firm.
A customer who buys little but refers and influences many can be worth more than a heavy buyer who does neither, which is the entire point: optimizing CLV alone (Chapter 15) undervalues engaged customers and can lead a firm to fire its most valuable advocates. The decomposition is formative—the four components are distinct value sources that are summed, not interchangeable reflections of a latent engagement (Table 3.1)—so the appropriate reliability question is not internal consistency but whether the components are correctly weighted and non-overlapping. The chunk simulates a customer base and shows how rank-ordering customers by total engagement value reshuffles the priority list relative to CLV alone.
Code
set.seed(2010)n<-5000# Four value components; deliberately NOT perfectly correlated, so that# CLV alone mis-ranks customers relative to total engagement value.clv<-rgamma(n, shape =2, scale =120)# own-purchase valuecrv<-rgamma(n, shape =1.2, scale =60)*(runif(n)<.5)# referral valueciv<-rgamma(n, shape =1.1, scale =90)*(runif(n)<.4)# influencer valueckv<-rgamma(n, shape =1.0, scale =25)*(runif(n)<.3)# knowledge valuecev<-clv+crv+civ+ckv# total engagement valuetop_clv<-order(clv, decreasing =TRUE)[1:500]# top 500 by CLVtop_cev<-order(cev, decreasing =TRUE)[1:500]# top 500 by CEVoverlap<-length(intersect(top_clv, top_cev))cat(sprintf("Correlation CLV vs total engagement value: %.2f\n", cor(clv, cev)))#> Correlation CLV vs total engagement value: 0.86cat(sprintf("Of the top-500 customers by CLV, only %d are also top-500 by CEV.\n", overlap))#> Of the top-500 customers by CLV, only 349 are also top-500 by CEV.cat(sprintf("=> %d high-engagement customers are INVISIBLE to a CLV-only ranking.\n",500-overlap))#> => 151 high-engagement customers are INVISIBLE to a CLV-only ranking.
A non-trivial share of the most valuable customers by total engagement value are not in the CLV top tier, so a firm that targets and rewards on CLV alone systematically neglects its referral and influence engine. Engagement, made measurable through the CEV decomposition, is the construct that corrects that blind spot.
8.3 Word of Mouth
The most-studied engagement behavior is word of mouth—informal, consumer-to-consumer communication about products and brands. It is essential to distinguish WOM-the-construct from the diffusion mechanics of Chapter 27: this chapter treats WOM as a property of consumers (their propensity to talk, the valence and volume of what they say, and its antecedents), while the virality chapter treats the network dynamics by which messages spread. As a construct, WOM is characterized by valence (positive vs. negative), volume (how much), and the gap between intention and behavior.
Its antecedents are well mapped. Anderson (1998) establishes that the satisfaction–WOM relationship is asymmetric and U-shaped: both highly satisfied and highly dissatisfied customers generate more word of mouth than indifferent ones, and the dissatisfied generate disproportionately much—the negativity that recurs throughout this book (the loss-aversion theme of Chapter 4). Brown et al. (2005) identify the drivers of positive WOM intentions and behaviors, finding commitment and identification (the constructs of Chapter 5 and Chapter 7) central. Berger (2014) synthesizes the psychology of why people talk, organizing the drivers into five functions—impression management, emotion regulation, information acquisition, social bonding, and persuasion—and the meta-analysis of De Matos and Rossi (2008) quantifies the antecedents across studies, confirming satisfaction, loyalty, commitment, perceived quality, and trust as robust drivers. WOM is thus the social output of nearly every other construct in this part.
8.3.1 The U-shaped satisfaction–WOM relationship
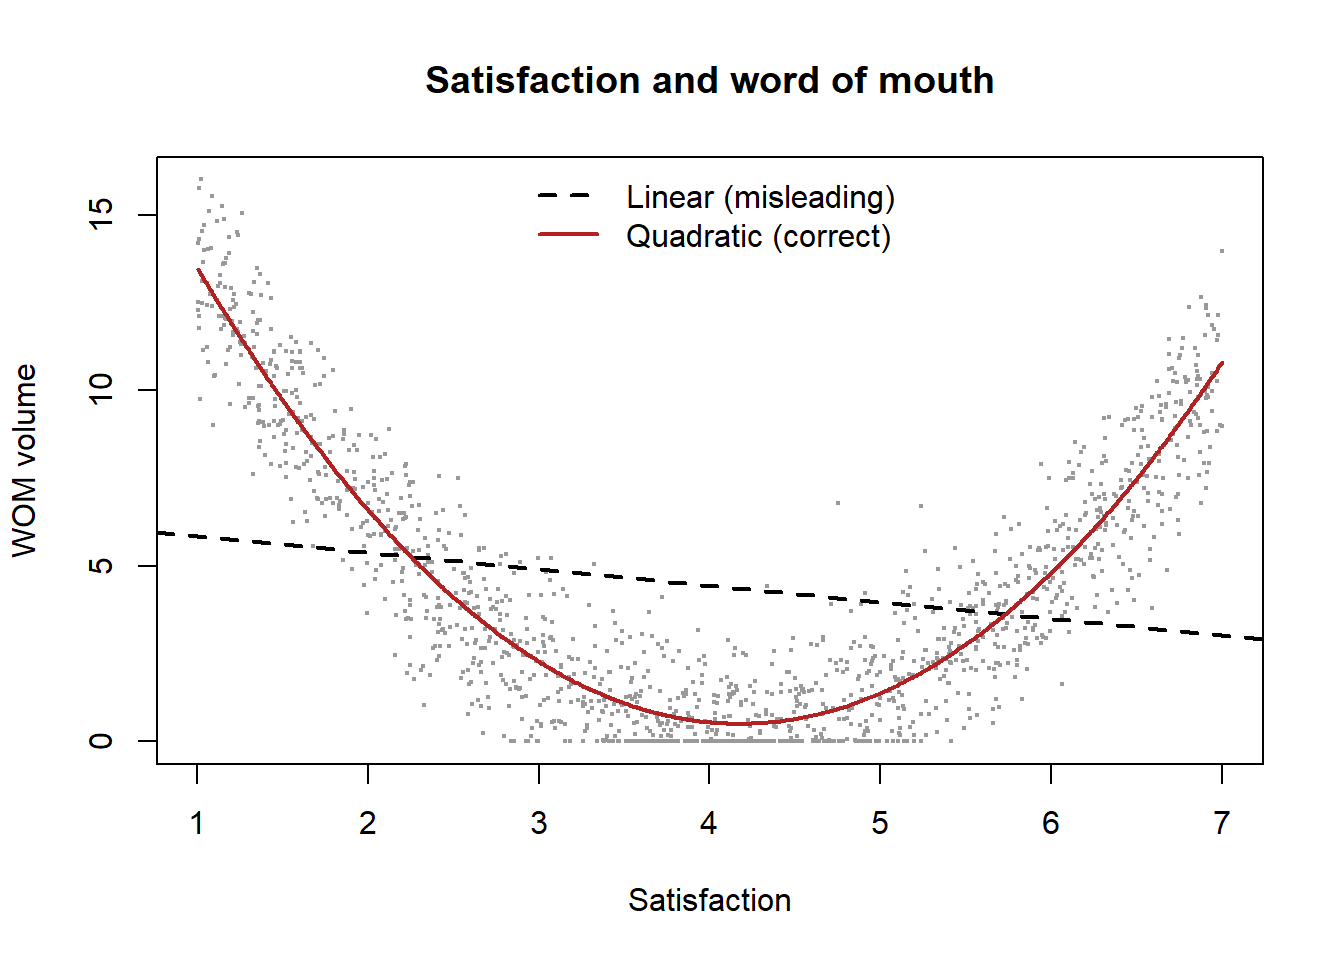
The Anderson (1998) finding is a clean nonlinearity worth making explicit, because a linear model would conclude—wrongly—that satisfaction monotonically increases word of mouth. The chunk simulates WOM volume as a U-shaped function of satisfaction with a steeper negative arm (the dissatisfied talk more), and contrasts the misleading linear fit with the correct quadratic one.
Code
set.seed(1998)n<-1500sat<-runif(n, 1, 7)# satisfaction, 1..7center<-4# U-shape with a steeper negative arm; minimum WOM near the middle.wom<-1.2*(sat-center)^2+0.9*pmax(center-sat, 0)+# extra volume on the dissatisfied sidernorm(n, sd =1.5)wom<-pmax(wom, 0)lin<-lm(wom~sat)quad<-lm(wom~poly(sat, 2))cat(sprintf("Linear fit R^2 : %.3f\n", summary(lin)$r.squared))#> Linear fit R^2 : 0.045cat(sprintf("Quadratic fit R^2 : %.3f\n", summary(quad)$r.squared))#> Quadratic fit R^2 : 0.881plot(sat, wom, pch =19, cex =0.3, col ="grey60", xlab ="Satisfaction", ylab ="WOM volume", main ="Satisfaction and word of mouth")ord<-order(sat)abline(lin, lty =2, lwd =2)lines(sat[ord], predict(quad)[ord], col ="firebrick", lwd =2)legend("top", c("Linear (misleading)", "Quadratic (correct)"), lty =c(2, 1), col =c("black", "firebrick"), lwd =2, bty ="n")
Word-of-mouth volume as a U-shaped function of satisfaction (Anderson 1998): the very satisfied and the very dissatisfied talk most, with a steeper dissatisfaction arm. A linear fit (dashed) misses the mechanism entirely.
The quadratic fit captures the U-shape the linear model flattens into near-nothing: word of mouth is generated at both tails of satisfaction, and the dissatisfied tail is louder. A firm reading a near-zero linear coefficient would wrongly conclude satisfaction does not drive WOM, when in fact it drives it nonlinearly and asymmetrically—the same lesson, in a new construct, that the satisfaction chapter drew about asymmetric market pricing.
8.4 Measurement and the Construct Boundary
Engagement is the construct most at risk of conceptual inflation. Because it is defined expansively—any value-creating activity beyond purchase—it threatens to absorb involvement (its motivational antecedent), participation, co-creation, loyalty (Chapter 5), and word of mouth (one of its behaviors) into an undifferentiated whole. Two disciplines keep the boundary sharp. First, distinguishing the psychological state of engagement (a motivational, cognitive-affective disposition) from engagement behaviors (the observable CEBs), and measuring each with its own indicators rather than conflating cause and manifestation. Second, recognizing that engagement value (CEV) is formative while the engagement state is reflective—applying internal-consistency reliability to the former or summative weighting to the latter is the model-misspecification error of Chapter 3. Word of mouth, similarly, must keep intention and behavior separate (the gap is large and predictable) and valence explicit (positive and negative WOM have different antecedents and opposite effects), or its measures collapse distinctions the theory depends on.
8.5 Key Takeaways
Involvement is perceived personal relevance (Zaichkowsky 1985)—enduring vs. situational, by object—and matters chiefly as a moderator: it routes persuasion between the central and peripheral paths of the ELM (Petty, Cacioppo, and Schumann 1983), so message effects are involvement-conditional (Section 8.1.1).
Word of mouth is a construct of valence, volume, and intention-vs-behavior, distinct from the diffusion mechanics of Chapter 27; the satisfaction–WOM link is U-shaped and asymmetric(Anderson 1998) (Section 8.3.1), positive WOM is driven by commitment and identification (Brown et al. 2005), and the psychology of talking spans five functions (Berger 2014), with robust meta-analytic antecedents (De Matos and Rossi 2008).
The family’s measurement discipline is to separate state from behavior and reflective from formative, and to keep WOM intention/behavior and valence explicit, on pain of the misspecification errors of Chapter 3.
8.6 Further Reading
Involvement begins with Zaichkowsky (1985) and its moderating role with the ELM of Petty, Cacioppo, and Schumann (1983). For customer engagement, read Doorn et al. (2010) for the behavioral foundation, Brodie et al. (2011) for the conceptual domain, and Pansari and Kumar (2017) for the antecedents-and-consequences synthesis, with Kumar et al. (2010) for the engagement-value decomposition (and Chapter 15 for CLV proper). On word of mouth, Anderson (1998) establishes the U-shape, Brown et al. (2005) the positive-WOM antecedents, Berger (2014) the psychology of transmission, and De Matos and Rossi (2008) the meta-analytic evidence; the diffusion side is Chapter 27. The discriminant- and specification-validity cautions are, as ever, the apparatus of Chapter 3.
Berger, Jonah. 2014. “Word of Mouth and Interpersonal Communication: A Review and Directions for Future Research.”Journal of Consumer Psychology 24 (4): 586–607. https://doi.org/10.1016/j.jcps.2014.05.002.
Brodie, Roderick J., Linda D. Hollebeek, Biljana Jurić, and Ana Ilić. 2011. “Customer Engagement: Conceptual Domain, Fundamental Propositions, and Implications for Research.”Journal of Service Research 14 (3): 252–71. https://doi.org/10.1177/1094670511411703.
Brown, Tom J., Thomas E. Barry, Peter A. Dacin, and Richard F. Gunst. 2005. “Spreading the Word: Investigating Antecedents of Consumers’ Positive Word-of-Mouth Intentions and Behaviors in a Retailing Context.”Journal of the Academy of Marketing Science 33 (2): 123–38. https://doi.org/10.1177/0092070304268417.
De Matos, Celso Augusto, and Carlos Alberto Vargas Rossi. 2008. “Word-of-Mouth Communications in Marketing: A Meta-Analytic Review of the Antecedents and Moderators.”Journal of the Academy of Marketing Science 36 (4): 578–96. https://doi.org/10.1007/s11747-008-0121-1.
Doorn, Jenny van, Katherine N. Lemon, Vikas Mittal, Stephan Nass, Doreeén Pick, Peter Pirner, and Peter C. Verhoef. 2010. “Customer Engagement Behavior: Theoretical Foundations and Research Directions.”Journal of Service Research 13 (3): 253–66. https://doi.org/10.1177/1094670510375599.
Hollebeek, Linda. 2011. “Exploring Customer Brand Engagement: Definition and Themes.”Journal of Strategic Marketing 19 (7): 555–73. https://doi.org/10.1080/0965254x.2011.599493.
Kumar, V., Lerzan Aksoy, Bas Donkers, Rajkumar Venkatesan, Thorsten Wiesel, and Sebastian Tillmanns. 2010. “Undervalued or Overvalued Customers: Capturing Total Customer Engagement Value.”Journal of Service Research 13 (3): 297–310. https://doi.org/10.1177/1094670510375602.
Pansari, Anita, and V. Kumar. 2017. “Customer Engagement: The Construct, Antecedents, and Consequences.”Journal of the Academy of Marketing Science 45 (3): 294–311. https://doi.org/10.1007/s11747-016-0485-6.
Petty, Richard E., John T. Cacioppo, and David Schumann. 1983. “Central and Peripheral Routes to Advertising Effectiveness: The Moderating Role of Involvement.”Journal of Consumer Research 10 (2): 135. https://doi.org/10.1086/208954.
Zaichkowsky, Judith Lynne. 1985. “Measuring the Involvement Construct.”Journal of Consumer Research 12 (3): 341–52. https://doi.org/10.1086/208520.
Source Code
# Engagement, Involvement, and Word of Mouth {#sec-engagement}The constructs so far have described the consumer as an evaluator (@sec-evaluative),a relationship partner (@sec-relational), and a brand-identifier (@sec-brand-self).This chapter turns to the consumer as a *participant*—someone whose contribution to afirm extends past the purchase to include attention, effort, advocacy, content, andreferrals. Three constructs organize this participatory turn. **Involvement** is themotivational state—the personal relevance of an object that determines how muchcognitive effort a consumer will expend on it. **Engagement** is the set of behavioraland psychological manifestations of an active relationship that go *beyond* transactions.And **word of mouth** (WOM) is the social output—the informal communication aboutproducts and brands that consumers direct at other consumers, and that has become, inthe digital era, the most consequential and most measurable of the three.These constructs have moved from the periphery of marketing to its center as firms haverecognized that a customer's value is not exhausted by what they buy: a customer whowrites reviews, refers friends, and defends the brand creates value through channelsthat transaction data alone cannot see. We develop involvement first, as themotivational antecedent and a moderator that reshapes how all persuasion works; thencustomer engagement, including its decomposition into a total *engagement value*; thenword of mouth as a construct distinct from the *mechanics* of diffusion treated in@sec-virality. As throughout this part, the measurement subtext is discriminantvalidity: engagement, involvement, participation, and WOM-intention are easy to defineapart and hard to keep apart in data.## Involvement {#sec-eng-involvement}**Involvement** is a person's perceived relevance of an object based on inherent needs,values, and interests [@zaichkowsky1985]. It is a *motivational* construct: highinvolvement means the object matters to the consumer, which mobilizes attention,information search, and elaboration; low involvement means it does not, so decisions aremade with minimal cognitive effort. @zaichkowsky1985 develops the Personal InvolvementInventory to measure it reflectively, and the construct is standardly partitioned alongtwo axes—**enduring** involvement (a stable interest in a category) versus **situational**involvement (temporarily heightened by a purchase occasion or risk), and by object(*product*, *advertising*, and *purchase-decision* involvement).Involvement's theoretical importance is less as an outcome than as a **moderator** of howpersuasion operates. The Elaboration Likelihood Model [@petty1983] holds that persuasiontravels two routes: a **central route**, in which highly involved consumers scrutinize thequality of an argument, and a **peripheral route**, in which uninvolved consumers respondto surface cues (source attractiveness, number of arguments, music) without evaluatingsubstance. Involvement determines which route dominates, so the *same* advertisementpersuades through different mechanisms depending on the audience's involvement—a resultthat reshapes advertising strategy (@sec-advertising) and that makes involvement aprerequisite variable for almost any study of message effects.### Involvement as a moderator of message effects {#sec-eng-elm}The ELM's central prediction is an *interaction*: argument quality matters more forhigh-involvement consumers, while peripheral cues matter more for low-involvementconsumers. The chunk simulates this crossover and recovers the two interactions,illustrating why a study that ignores involvement will estimate an average message effectthat describes no actual consumer.```{r}#| message: false#| warning: false#| label: eng-elm-moderationset.seed(1983)n <-4000involvement <-rbinom(n, 1, 0.5) # 1 = high, 0 = lowarg_quality <-rnorm(n) # strength of the message's argumentsperiph_cue <-rnorm(n) # attractiveness/number of cues# High-involvement: persuasion via argument quality (central route).# Low-involvement: persuasion via peripheral cues.attitude <-0.10+0.55* involvement * arg_quality +# central route (only when involved)0.10* (1- involvement) * arg_quality +0.50* (1- involvement) * periph_cue +# peripheral route (only when uninvolved)0.10* involvement * periph_cue +rnorm(n, sd =0.8)fit <-lm(attitude ~ arg_quality * involvement + periph_cue * involvement)co <-round(summary(fit)$coefficients[, c("Estimate", "Pr(>|t|)")], 3)# Show the main effects and their involvement interactions (robust to term naming).keep <-grepl("arg_quality|periph_cue", rownames(co))print(co[keep, ])```The positive `arg_quality:involvement` interaction and the negative`periph_cue:involvement` interaction are the ELM crossover: involvement routes persuasion.An analyst who omitted involvement and regressed attitude on argument quality alone wouldrecover a muddy average, understating the central route for the involved and missing theperipheral route for the uninvolved entirely.## Customer Engagement {#sec-eng-engagement}**Customer engagement** generalizes the relationship beyond the transaction. @vandoorn2010define **customer engagement behaviors** (CEBs) as a customer's behavioral manifestationstoward a firm, beyond purchase, that result from motivational drivers—writing reviews,making recommendations, helping other customers, blogging, and otherwise contributing.@brodie2011 give the construct its conceptual domain, framing engagement as an**interactive, co-creative** experience with a focal object that comprises cognitive,emotional, and behavioral dimensions and that arises within an iterative process ofrelationship development. @hollebeek2011 develops the brand-specific version. The commonthread is that engagement captures value-creating customer activity that purchase metricsmiss, which is why it rose to prominence exactly as social media made such activityvisible and abundant.@pansari2017 supply the nomological network: engagement is built on a foundation ofsatisfaction *and* emotion (a relationship must be both satisfying and emotionallyconnected to become engaged), and it produces value through **direct** contributions(purchases) and **indirect** contributions (referrals, influence, feedback). Thedirect/indirect split is the conceptual bridge to a measurement program that tries to puta number on the whole of a customer's value.### Total customer engagement value {#sec-eng-cev}@kumar2010cev decompose a customer's total worth into four additive components—the movethat lets engagement be *valued*, not just described:- **Customer Lifetime Value (CLV):** the discounted margin from the customer's own purchases (the construct developed in @sec-clv).- **Customer Referral Value (CRV):** value from customers acquired through this customer's formal referrals.- **Customer Influencer Value (CIV):** value from this customer's influence on other customers and prospects through word of mouth and social spread.- **Customer Knowledge Value (CKV):** value from the feedback and ideas the customer contributes to the firm.A customer who buys little but refers and influences many can be worth more than a heavybuyer who does neither, which is the entire point: optimizing CLV alone (@sec-clv)*undervalues* engaged customers and can lead a firm to fire its most valuable advocates.The decomposition is **formative**—the four components are distinct value sources that aresummed, not interchangeable reflections of a latent engagement (@tbl-reflective-formative)—sothe appropriate reliability question is not internal consistency but whether the componentsare correctly weighted and non-overlapping. The chunk simulates a customer base and showshow rank-ordering customers by total engagement value reshuffles the priority list relativeto CLV alone.```{r}#| message: false#| warning: false#| label: eng-cev-decompset.seed(2010)n <-5000# Four value components; deliberately NOT perfectly correlated, so that# CLV alone mis-ranks customers relative to total engagement value.clv <-rgamma(n, shape =2, scale =120) # own-purchase valuecrv <-rgamma(n, shape =1.2, scale =60) * (runif(n) < .5) # referral valueciv <-rgamma(n, shape =1.1, scale =90) * (runif(n) < .4) # influencer valueckv <-rgamma(n, shape =1.0, scale =25) * (runif(n) < .3) # knowledge valuecev <- clv + crv + civ + ckv # total engagement valuetop_clv <-order(clv, decreasing =TRUE)[1:500] # top 500 by CLVtop_cev <-order(cev, decreasing =TRUE)[1:500] # top 500 by CEVoverlap <-length(intersect(top_clv, top_cev))cat(sprintf("Correlation CLV vs total engagement value: %.2f\n", cor(clv, cev)))cat(sprintf("Of the top-500 customers by CLV, only %d are also top-500 by CEV.\n", overlap))cat(sprintf("=> %d high-engagement customers are INVISIBLE to a CLV-only ranking.\n",500- overlap))```A non-trivial share of the most valuable customers by total engagement value are *not* inthe CLV top tier, so a firm that targets and rewards on CLV alone systematically neglectsits referral and influence engine. Engagement, made measurable through the CEVdecomposition, is the construct that corrects that blind spot.## Word of Mouth {#sec-eng-wom}The most-studied engagement behavior is **word of mouth**—informal, consumer-to-consumercommunication about products and brands. It is essential to distinguish WOM-the-*construct*from the *diffusion mechanics* of @sec-virality: this chapter treats WOM as a property ofconsumers (their propensity to talk, the valence and volume of what they say, and itsantecedents), while the virality chapter treats the network dynamics by which messagesspread. As a construct, WOM is characterized by **valence** (positive vs. negative),**volume** (how much), and the gap between **intention** and **behavior**.Its antecedents are well mapped. @anderson1998wom establishes that the satisfaction–WOMrelationship is **asymmetric and U-shaped**: both highly satisfied *and* highlydissatisfied customers generate more word of mouth than indifferent ones, and thedissatisfied generate disproportionately much—the negativity that recurs throughout thisbook (the loss-aversion theme of @sec-satisfaction). @brown2005wom identify the drivers of*positive* WOM intentions and behaviors, finding commitment and identification (theconstructs of @sec-relational and @sec-brand-self) central. @berger2014wom synthesizes thepsychology of *why* people talk, organizing the drivers into five functions—impressionmanagement, emotion regulation, information acquisition, social bonding, and persuasion—andthe meta-analysis of @dematos2008 quantifies the antecedents across studies, confirmingsatisfaction, loyalty, commitment, perceived quality, and trust as robust drivers. WOM isthus the social *output* of nearly every other construct in this part.### The U-shaped satisfaction–WOM relationship {#sec-eng-wom-ushape}The @anderson1998wom finding is a clean nonlinearity worth making explicit, because alinear model would conclude—wrongly—that satisfaction monotonically increases word ofmouth. The chunk simulates WOM volume as a U-shaped function of satisfaction with asteeper negative arm (the dissatisfied talk more), and contrasts the misleading linear fitwith the correct quadratic one.```{r}#| message: false#| warning: false#| label: eng-wom-ushape#| fig-cap: "Word-of-mouth volume as a U-shaped function of satisfaction (Anderson 1998): the very satisfied and the very dissatisfied talk most, with a steeper dissatisfaction arm. A linear fit (dashed) misses the mechanism entirely."set.seed(1998)n <-1500sat <-runif(n, 1, 7) # satisfaction, 1..7center <-4# U-shape with a steeper negative arm; minimum WOM near the middle.wom <-1.2* (sat - center)^2+0.9*pmax(center - sat, 0) +# extra volume on the dissatisfied sidernorm(n, sd =1.5)wom <-pmax(wom, 0)lin <-lm(wom ~ sat)quad <-lm(wom ~poly(sat, 2))cat(sprintf("Linear fit R^2 : %.3f\n", summary(lin)$r.squared))cat(sprintf("Quadratic fit R^2 : %.3f\n", summary(quad)$r.squared))plot(sat, wom, pch =19, cex =0.3, col ="grey60",xlab ="Satisfaction", ylab ="WOM volume", main ="Satisfaction and word of mouth")ord <-order(sat)abline(lin, lty =2, lwd =2)lines(sat[ord], predict(quad)[ord], col ="firebrick", lwd =2)legend("top", c("Linear (misleading)", "Quadratic (correct)"),lty =c(2, 1), col =c("black", "firebrick"), lwd =2, bty ="n")```The quadratic fit captures the U-shape the linear model flattens into near-nothing: wordof mouth is generated at *both* tails of satisfaction, and the dissatisfied tail is louder.A firm reading a near-zero linear coefficient would wrongly conclude satisfaction does notdrive WOM, when in fact it drives it nonlinearly and asymmetrically—the same lesson, in anew construct, that the satisfaction chapter drew about asymmetric market pricing.## Measurement and the Construct Boundary {#sec-eng-measurement}Engagement is the construct most at risk of conceptual inflation. Because it is definedexpansively—any value-creating activity beyond purchase—it threatens to absorb involvement(its motivational antecedent), participation, co-creation, loyalty (@sec-relational), andword of mouth (one of its behaviors) into an undifferentiated whole. Two disciplines keepthe boundary sharp. First, distinguishing the **psychological state** of engagement (amotivational, cognitive-affective disposition) from **engagement behaviors** (the observableCEBs), and measuring each with its own indicators rather than conflating cause andmanifestation. Second, recognizing that *engagement value* (CEV) is **formative** while the*engagement state* is **reflective**—applying internal-consistency reliability to the formeror summative weighting to the latter is the model-misspecification error of@sec-construct-vs-variable. Word of mouth, similarly, must keep **intention** and **behavior**separate (the gap is large and predictable) and **valence** explicit (positive and negativeWOM have different antecedents and opposite effects), or its measures collapse distinctions thetheory depends on.## Key Takeaways {#sec-eng-takeaways}- **Involvement** is perceived personal relevance [@zaichkowsky1985]—enduring vs. situational, by object—and matters chiefly as a **moderator**: it routes persuasion between the central and peripheral paths of the ELM [@petty1983], so message effects are involvement-conditional (@sec-eng-elm).- **Customer engagement** captures value-creating activity beyond purchase—engagement *behaviors* [@vandoorn2010] and an interactive, co-creative *state* [@brodie2011; @hollebeek2011]—built on satisfaction plus emotion and producing direct and indirect value[@pansari2017].- **Total customer engagement value** decomposes a customer into CLV + referral + influencer + knowledge value [@kumar2010cev]; it is **formative**, and CLV-only targeting (@sec-clv) systematically undervalues engaged advocates (@sec-eng-cev).- **Word of mouth** is a construct of valence, volume, and intention-vs-behavior, distinct from the diffusion mechanics of @sec-virality; the satisfaction–WOM link is **U-shaped and asymmetric** [@anderson1998wom] (@sec-eng-wom-ushape), positive WOM is driven by commitment and identification [@brown2005wom], and the psychology of talking spans five functions[@berger2014wom], with robust meta-analytic antecedents [@dematos2008].- The family's measurement discipline is to separate **state from behavior** and **reflective from formative**, and to keep WOM **intention/behavior** and **valence** explicit, on pain of the misspecification errors of @sec-construct-vs-variable.## Further Reading {#sec-eng-further}Involvement begins with @zaichkowsky1985 and its moderating role with the ELM of @petty1983.For customer engagement, read @vandoorn2010 for the behavioral foundation, @brodie2011 forthe conceptual domain, and @pansari2017 for the antecedents-and-consequences synthesis, with@kumar2010cev for the engagement-value decomposition (and @sec-clv for CLV proper). On wordof mouth, @anderson1998wom establishes the U-shape, @brown2005wom the positive-WOMantecedents, @berger2014wom the psychology of transmission, and @dematos2008 the meta-analyticevidence; the diffusion side is @sec-virality. The discriminant- and specification-validitycautions are, as ever, the apparatus of @sec-construct-vs-variable.